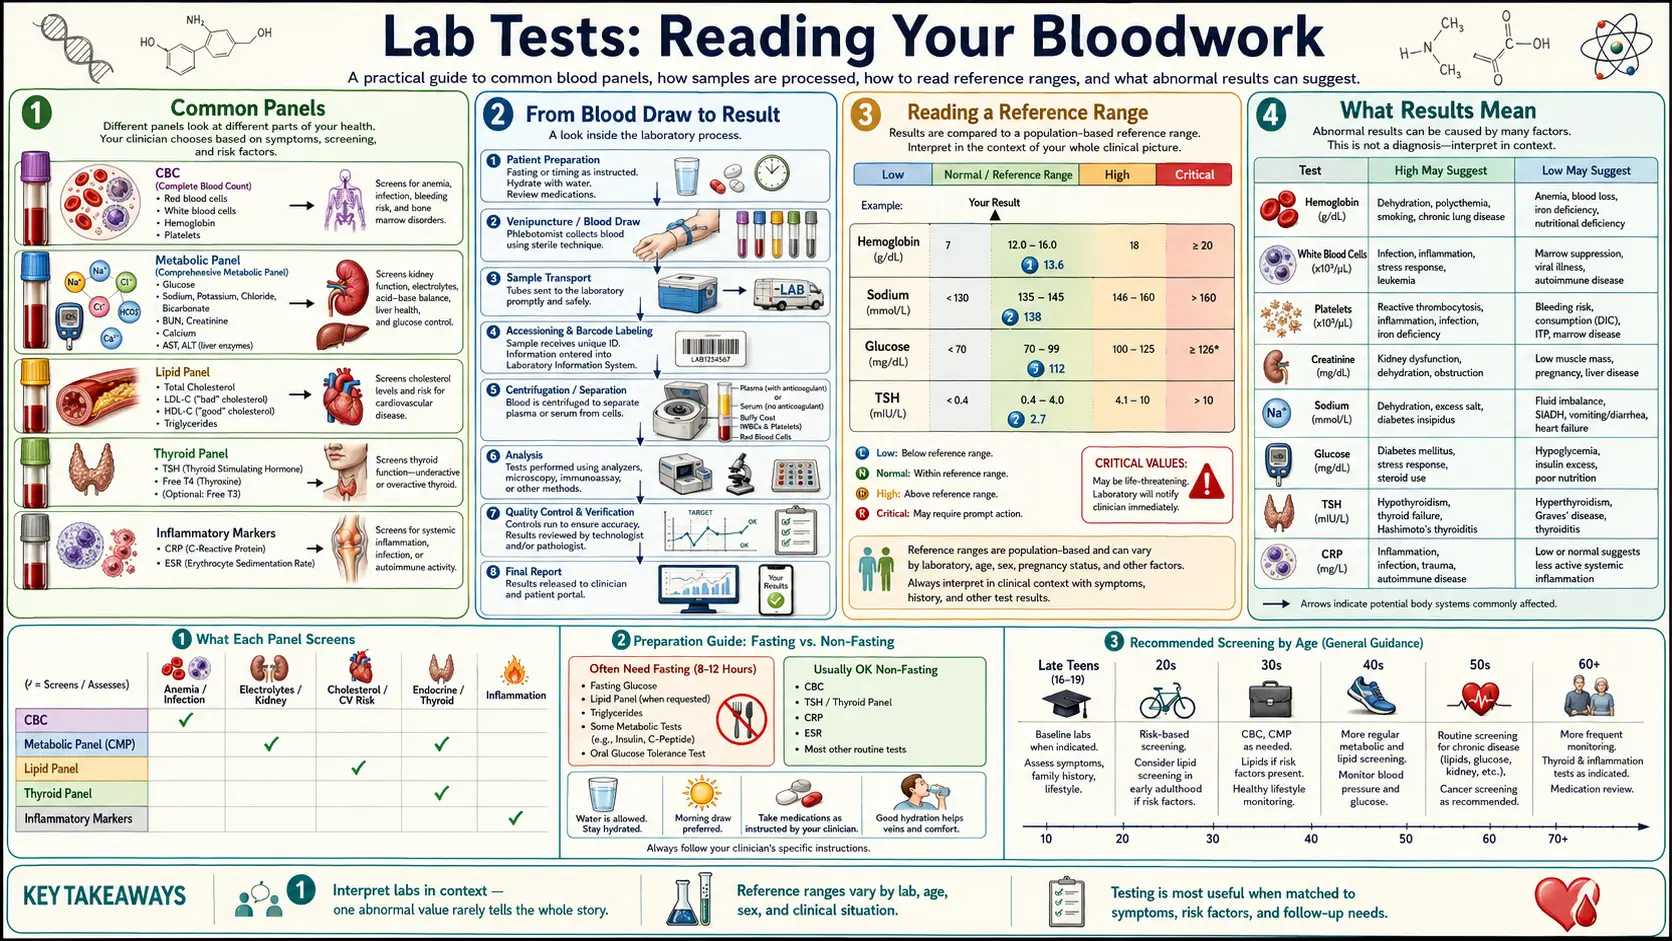


This visual reference helps you understand the most commonly ordered annual lab tests at a glance. Each marker includes a color-coded range bar showing where low, normal, and high values fall so you can quickly interpret your results and have more informed conversations with your doctor.
Table of Contents
How to Read the Range Bars
Each bar is divided into segments representing where your result falls. The numbers on each segment show the threshold values. Ranges shown are standard adult reference ranges; your lab may use slightly different values.
Complete Blood Count (CBC)
The CBC is the most frequently ordered blood test. It evaluates red blood cells, white blood cells, and platelets to detect infections, anemia, clotting disorders, and immune system conditions.
WBC — White Blood Cells (×10³/µL)
RBC — Red Blood Cells, Male (×10⁶/µL)
RBC — Red Blood Cells, Female (×10⁶/µL)
Hemoglobin, Male (g/dL)
Hemoglobin, Female (g/dL)
Hematocrit, Male (%)
Hematocrit, Female (%)
Platelets (×10³/µL)
MCV — Mean Corpuscular Volume (fL)
Comprehensive Metabolic Panel (CMP)
The CMP is a group of 14 tests that evaluate kidney function, liver function, electrolyte balance, and blood sugar — providing a broad overview of your body's chemical balance and metabolism.
Glucose, Fasting (mg/dL)
BUN — Blood Urea Nitrogen (mg/dL)
Creatinine (mg/dL)
eGFR — Estimated Glomerular Filtration Rate (mL/min)
Sodium (mEq/L)
Potassium (mEq/L)
Calcium (mg/dL)
Albumin (g/dL)
Total Protein (g/dL)
ALT — Alanine Aminotransferase (U/L)
AST — Aspartate Aminotransferase (U/L)
ALP — Alkaline Phosphatase (U/L)
Bilirubin, Total (mg/dL)
Lipid Panel
The lipid panel measures fats and fatty substances in the blood to assess cardiovascular disease risk. It is one of the most important screening tests for heart health.
Total Cholesterol (mg/dL)
LDL Cholesterol (mg/dL)
HDL Cholesterol (mg/dL)
Triglycerides (mg/dL)
VLDL Cholesterol (mg/dL)
Thyroid Panel
The thyroid panel evaluates how well your thyroid gland is functioning. Thyroid hormones regulate metabolism, energy, body temperature, heart rate, and many other vital processes.
TSH — Thyroid-Stimulating Hormone (mIU/L)
Free T4 — Thyroxine (ng/dL)
Free T3 — Triiodothyronine (pg/mL)
Iron Panel
The iron panel measures how much iron is in your blood and how well your body stores and transports it. Iron is essential for oxygen delivery, energy production, and immune function.
Serum Iron (µg/dL)
Ferritin, Male (ng/mL)
Ferritin, Female (ng/mL)
TIBC — Total Iron-Binding Capacity (µg/dL)
Transferrin Saturation (%)
Diabetes Markers
These markers assess blood sugar regulation and diabetes risk. HbA1c reflects your average blood sugar over the past 2-3 months, while fasting glucose and insulin provide a snapshot of current metabolic status.
HbA1c — Hemoglobin A1c (%)
Fasting Glucose (mg/dL)
Fasting Insulin (µIU/mL)
Inflammatory Markers
Chronic low-grade inflammation is linked to heart disease, cancer, diabetes, and autoimmune conditions. These tests help identify hidden inflammation before it progresses to serious disease.
hs-CRP — High-Sensitivity C-Reactive Protein (mg/L)
ESR, Male — Erythrocyte Sedimentation Rate (mm/hr)
ESR, Female — Erythrocyte Sedimentation Rate (mm/hr)
Homocysteine (µmol/L)
Hormone Panel
Hormones regulate virtually every process in your body — from energy and mood to reproductive health and body composition. Imbalances can cause fatigue, weight gain, depression, and many other symptoms.
Testosterone, Male (ng/dL)
Testosterone, Female (ng/dL)
Estradiol, Premenopausal (pg/mL)
Cortisol, Morning (µg/dL)
DHEA-S, Male (µg/dL)
DHEA-S, Female (µg/dL)
Vitamins & Minerals
Nutrient deficiencies are surprisingly common and can cause wide-ranging symptoms — from fatigue and brain fog to nerve damage and bone loss. These tests identify the most critical nutritional gaps.
Vitamin D (25-OH) (ng/mL)
Vitamin B12 (pg/mL)
Folate (ng/mL)
Magnesium (mg/dL)
Urinalysis
A urinalysis checks the appearance, concentration, and content of urine. It can detect kidney disease, urinary tract infections, diabetes, and other metabolic conditions.
pH
Specific Gravity
Protein
Glucose
Coagulation Panel
Coagulation tests measure how well your blood clots. They are essential before surgeries, for monitoring blood-thinning medications, and for diagnosing bleeding or clotting disorders.
PT — Prothrombin Time (seconds)
INR — International Normalized Ratio (therapeutic on warfarin: 2.0–3.0)
aPTT — Activated Partial Thromboplastin Time (seconds)
Kidney Function (BUN, Creatinine, eGFR, Cystatin C)
BUN, creatinine, and eGFR appear on every Comprehensive Metabolic Panel and form the screening backbone for kidney function. Cystatin C is a muscle-mass-independent filtration marker that detects mild renal impairment earlier than creatinine and refines eGFR in non-standard body composition (frail elderly, athletes, amputees). Together they stage chronic kidney disease (CKD G1–G5) and detect acute kidney injury. Read the full Kidney Function guide →
Cystatin C (mg/L)
eGFR — CKD Staging (mL/min/1.73 m²)
Deep dives: BUN · Creatinine · eGFR · Cystatin C
Other Important Tests
These additional tests are frequently ordered during annual physicals and can reveal conditions such as gout, liver dysfunction, and prostate issues.
Uric Acid, Male (mg/dL)
Uric Acid, Female (mg/dL)
GGT — Gamma-Glutamyl Transferase (U/L)
PSA — Prostate-Specific Antigen, Male (ng/mL)
Specialized Cardiovascular & Hormonal Tests
These tests go beyond the standard annual panel to provide deeper insight into inflammation, cellular omega-3 status, and reproductive hormone reserve — tools increasingly used in preventive cardiology, integrative medicine, and fertility planning.
hs-CRP — High-Sensitivity C-Reactive Protein (mg/L)
The most clinically useful marker of low-grade chronic vascular inflammation and independent cardiovascular risk. Detects inflammation invisible to standard CRP. Target for optimal cardiovascular health: below 0.5 mg/L. Elevated by smoking, obesity, sleep apnea, periodontal disease, and metabolic syndrome. Read the full hs-CRP guide →
Omega-3 Index (EPA + DHA in red blood cell membranes) (%)
Measures EPA + DHA as a percentage of total fatty acids in red blood cell membranes — reflecting true 3-month average omega-3 tissue status. Predicts sudden cardiac death risk, arrhythmia, depression, cognitive aging, and preterm birth. Most Americans fall in the high-risk 4–5% range. Target: above 8%, optimal above 10%. Read the full Omega-3 Index guide →
AMH — Anti-Müllerian Hormone (women, age 35) (ng/mL)
Primary marker of ovarian reserve — how many eggs remain. Stable across the menstrual cycle; can be drawn any day. Declines with age, smoking, endometriosis surgery, and chemotherapy. Elevated in PCOS (>4–5 ng/mL). Reference ranges are age-specific — an AMH of 1.0 ng/mL means very different things at 28 vs. 40. Read the full AMH guide →
Genetic, Cardiac Injury & Autoimmune Tests
These tests assess genetic methylation risk, acute heart muscle injury, and autoimmune intestinal damage — three areas where targeted testing can dramatically change clinical management.
MTHFR Gene Mutation (C677T / A1298C) (genotype)
Identifies inherited variants that reduce the MTHFR enzyme responsible for converting folate to its active form (methylfolate) and recycling homocysteine. Homozygous C677T or compound heterozygous carriers need methylated B vitamins (methylfolate, methylcobalamin) and should monitor homocysteine. Always test homocysteine alongside MTHFR genotyping to assess functional impact. Read the full MTHFR guide →
Cardiac Troponin I & T (hs-cTnI / hs-cTnT) (ng/L)
The gold-standard marker of heart muscle injury. Elevated in acute myocardial infarction, myocarditis, heart failure, pulmonary embolism, and sepsis. High-sensitivity assays detect injury 10–100x earlier than conventional tests and enable 0h/1h rule-out protocols in emergency settings. A rising-and-falling pattern on serial measurements confirms acute MI. Read the full Cardiac Troponin guide →
Tissue Transglutaminase IgA (tTG-IgA) — Celiac Panel (U/mL)
The first-line serological test for celiac disease. Must be drawn while the patient is eating a gluten-containing diet — a gluten-free diet normalizes antibodies and causes false negatives. Always include total IgA to detect IgA deficiency, which invalidates all IgA-based results. Positive serology in adults requires duodenal biopsy confirmation. Read the full Celiac Disease Panel guide →
Conventional vs. Functional/Optimal Ranges
Most lab reports use conventional reference ranges that are derived from population averages — which include many unhealthy individuals. Functional medicine practitioners often use narrower, optimal ranges based on healthy populations and peer-reviewed research. For example, a conventional TSH range might be 0.4–4.0, while a functional optimal range is 1.0–2.5. Similarly, conventional fasting glucose of 65–99 may be considered normal, but functional practitioners prefer 75–86.
If your results fall within conventional ranges but you still experience symptoms, consider asking your provider about functional/optimal ranges — early intervention at the "sub-optimal" stage can prevent progression to diagnosable disease.
IMPORTANT DISCLAIMER: This page is an educational reference to help you understand your lab results. It does NOT replace professional medical interpretation. Reference ranges may vary between laboratories. Always discuss your results with a qualified healthcare provider who can consider your complete health picture, symptoms, medications, and medical history.
All Lab Tests A–Z
Every topic in this section, listed alphabetically — including the ones that do not belong to a standard panel above.
- ACE Level (Angiotensin-Converting Enzyme)
- ACTH Stimulation Test: Adrenal Insufficiency Diagnosis
- AFP Test: Alpha-Fetoprotein Lab Guide
- Albumin Test: Serum Albumin
- Aldolase
- Aldosterone-Renin Ratio (ARR)
- Ammonia (Blood Test)
- Amylase and Lipase
- ANA Test: Antinuclear Antibody for Autoimmune Disease
- ANCA Test: Antineutrophil Cytoplasmic Antibody Testing for Vasculitis
- Anti-CCP (Rheumatoid Arthritis Antibody)
- Anti-dsDNA (Lupus Antibody)
- Anti-Müllerian Hormone (AMH) Test
- Anti-Smith (Anti-Sm) Antibody Test
- Anticardiolipin Antibodies
- Apolipoprotein B (ApoB): Why It May Predict Your Heart Attack Better Than LDL Cholesterol
- aPTT Test: Activated Partial Thromboplastin Time
- Basic Metabolic Panel (BMP)
- Beta-2 Microglobulin
- Beta-hCG (Pregnancy Hormone)
- Blood Culture
- Blood Type (ABO and Rh)
- BNP and NT-proBNP Test: Diagnosing and Monitoring Heart Failure
- BNP and NT-proBNP: Cardiac Biomarker Guide
- C-Peptide Test
- CA-125 Test: Ovarian Cancer Marker Lab Guide
- Cardiac Troponin Test (Troponin I & T)
- CEA Test: Carcinoembryonic Antigen Lab Guide
- Celiac Disease Panel (tTG-IgA)
- Ceruloplasmin Test
- Coagulation Panel: PT, INR, and aPTT
- Complement (C3, C4, CH50)
- Complete Blood Count (CBC)
- Comprehensive Metabolic Panel (CMP)
- Continuous Glucose Monitor (CGM): Real-Time Metabolic Insight Through a Sensor on Your Arm
- Copper Test (Serum Copper and Ceruloplasmin)
- Coronary Calcium Score (CAC): The 10-Minute CT Scan That Sees Your Heart Disease Decades Before a Heart Attack
- Cortisol Test: Stress Hormone Levels and Adrenal Function
- Creatine Kinase (CK)
- Cystatin C
- D-Dimer Test: Fibrin Degradation and Clot Detection
- D-dimer Test: VTE Exclusion and Fibrinolytic Assessment
- DHEA-S Test: The Anti-Aging Hormone Marker
- ESR Test: Erythrocyte Sedimentation Rate and Inflammation
- Fasting Insulin: The Hidden Key to Metabolic Health
- Ferritin Test: Iron Storage Protein and Reference Ranges
- Fibrinogen Test
- Folate Test
- Fructosamine Test
- Full-Body MRI Screening: Benefits, Limits, Incidentalomas, and Whether to Get One
- G6PD Deficiency Test
- GGT (Gamma-Glutamyl Transferase): Liver Health and Oxidative Stress
- H. pylori Test
- Haptoglobin Test
- Heavy Metals Panel
- Hemoglobin A1C
- Hepatitis Panel
- High-Sensitivity C-Reactive Protein (hs-CRP) Test
- HOMA-IR (Insulin Resistance)
- Homocysteine: Cardiovascular Risk and Methylation Marker
- Hormone Panel
- IGF-1 Test
- Immunoglobulins (IgG, IgA, IgM, IgE)
- Inflammatory Markers
- Iron Panel
- Kidney Function Tests: BUN, Creatinine, eGFR, and Cystatin C
- Lactate (Lactic Acid)
- LDH Test: Lactate Dehydrogenase — Tissue Damage and Disease Activity Marker
- Lipase Test: Diagnosing Acute Pancreatitis and Pancreatic Disease
- Lipid Panel
- Lipoprotein(a): The Genetic Cardiovascular Risk Factor You Should Test Once in Your Life
- Liver Function Tests
- Magnesium Test: Serum and RBC Magnesium
- Mammogram
- Methylmalonic Acid (MMA)
- Microalbumin & Albumin-to-Creatinine Ratio (ACR)
- MTHFR Gene Mutation Testing
- Omega-3 Index Blood Test
- Parathyroid Hormone (PTH) Test
- Peripheral Blood Smear
- Prealbumin (Transthyretin) Test
- Procalcitonin Test (PCT): Bacterial Infection and Sepsis Marker
- Prothrombin Time (PT) and INR: Coagulation Pathway Testing
- PSA Test: Prostate-Specific Antigen Screening Guide
- PT/INR Test: Prothrombin Time and International Normalized Ratio
- RBC Folate Test
- Reticulocyte Count
- Reverse T3 (rT3) Test
- Rheumatoid Factor (RF) Test
- Selenium Test
- SHBG (Sex Hormone Binding Globulin) Test
- Testosterone Test: Total, Free, and Bioavailable
- Thyroid Antibodies (Anti-TPO & Anti-Thyroglobulin) Test
- Thyroid Panel
- Transferrin and TIBC Test
- Troponin Test: Cardiac Injury Marker for Heart Attack Diagnosis
- Tryptase
- Uric Acid Test: Gout, Kidney Health, and Cardiovascular Risk
- Urinalysis: Complete Urine Analysis Guide
- Vitamin B12 Test: Levels, Deficiency, and Interpretation
- Vitamin D Test (25-Hydroxyvitamin D)
- Zinc Test (Serum Zinc)