Comprehensive Metabolic Panel (CMP)
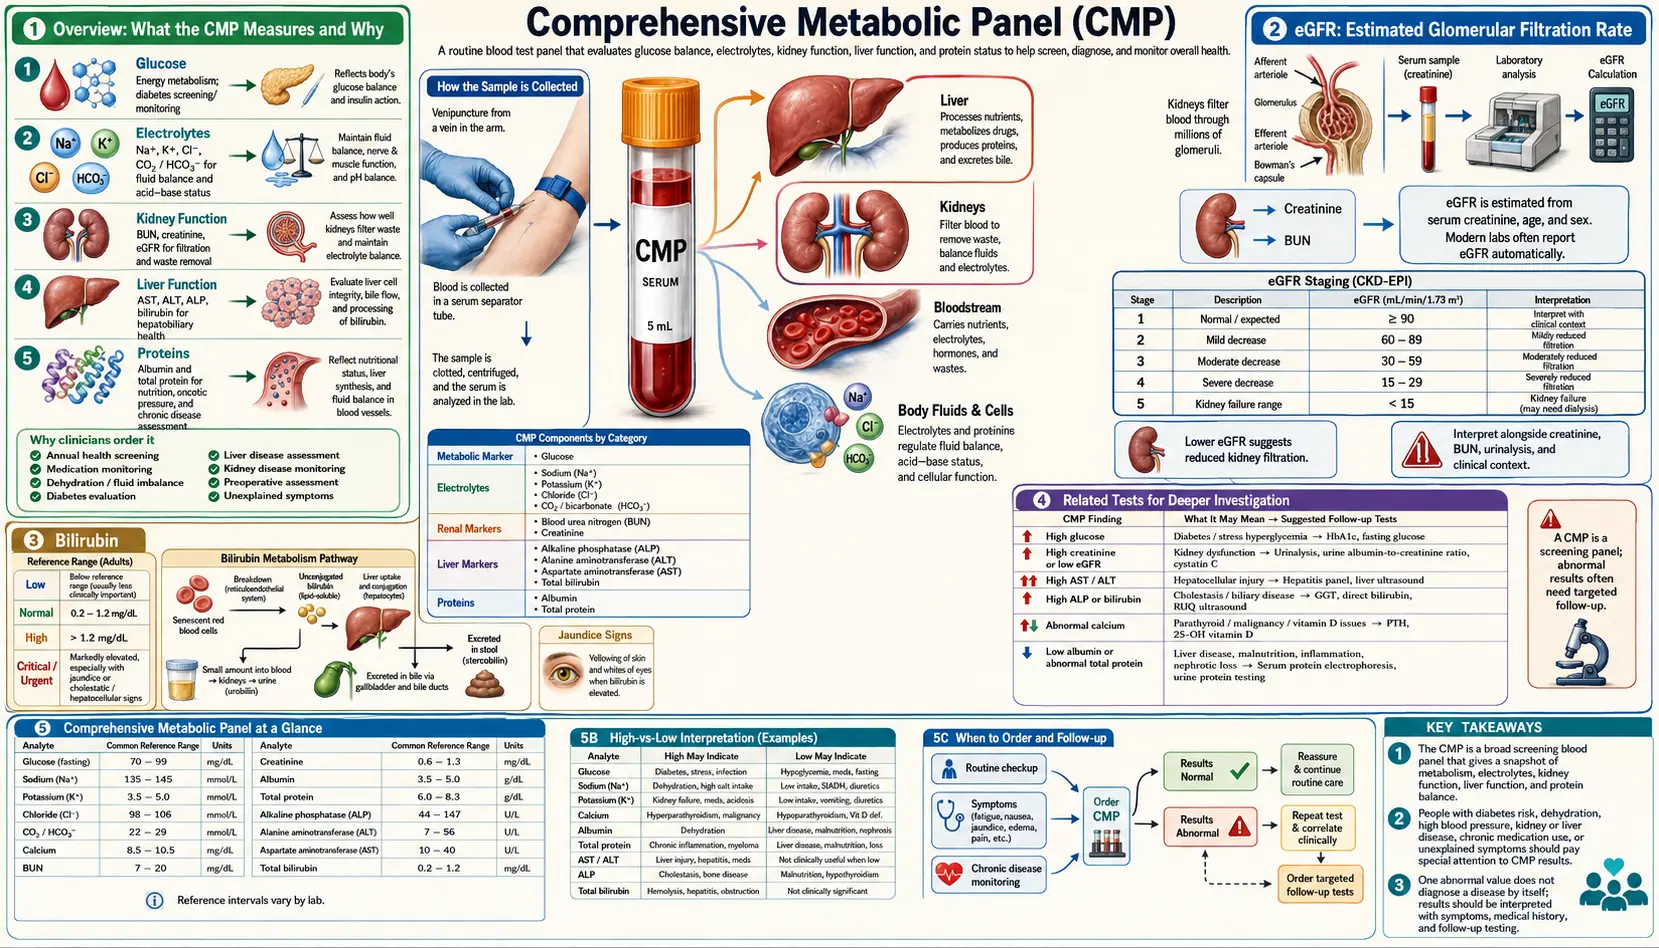
Table of Contents
- Overview: What the CMP Measures and Why
- Glucose (Fasting Blood Sugar)
- BUN and Creatinine: Kidney Function Markers
- BUN/Creatinine Ratio
- eGFR: Estimated Glomerular Filtration Rate
- Electrolytes: Sodium, Potassium, Chloride, and CO2
- Calcium
- Liver Enzymes: AST, ALT, and ALP
- Total Protein and Albumin
- Bilirubin
- Common Patterns Seen on a CMP
- Natural Support Strategies
- When to Retest
- Related Tests for Deeper Investigation
- Featured Videos
Overview: What the CMP Measures and Why
The Comprehensive Metabolic Panel, commonly referred to as a CMP, is one of the most frequently ordered blood tests in clinical medicine. It is a single panel that provides 14 individual measurements, giving practitioners a broad snapshot of metabolic health. These 14 tests evaluate blood sugar regulation, kidney function, electrolyte balance, acid-base status, liver health, and protein metabolism all at once.
The 14 tests included in a standard CMP are:
- Glucose (fasting blood sugar)
- BUN (blood urea nitrogen)
- Creatinine
- eGFR (estimated glomerular filtration rate, calculated)
- Sodium
- Potassium
- Chloride
- CO2 / Bicarbonate
- Calcium
- AST (aspartate aminotransferase)
- ALT (alanine aminotransferase)
- ALP (alkaline phosphatase)
- Total Protein
- Albumin
- Bilirubin (total)
From a functional medicine perspective, the CMP is invaluable not only for detecting overt disease but for identifying subclinical trends. Conventional reference ranges are designed to catch pathology once it has already developed. Functional or optimal ranges are narrower and can reveal early dysfunction, giving practitioners and patients the opportunity to intervene with diet, lifestyle, and targeted supplementation before disease becomes established.
The CMP requires a fasting blood draw, typically after 10 to 12 hours without food or caloric beverages. This fasting requirement is essential for an accurate glucose reading and can influence other markers as well.
Glucose (Fasting Blood Sugar)
Fasting glucose is one of the most important markers on the CMP. It reflects how well the body regulates blood sugar after an overnight fast and is a primary screening tool for diabetes and pre-diabetes.
Conventional reference range: 70 to 99 mg/dL is considered normal. A result of 100 to 125 mg/dL is classified as pre-diabetic (impaired fasting glucose), and 126 mg/dL or higher on two separate occasions indicates diabetes.
Functional optimal range: 82 to 88 mg/dL. In functional medicine, we prefer to see fasting glucose well within the conventional normal range. Values consistently above 90 mg/dL, even though they are technically "normal," may suggest early insulin resistance and warrant further investigation with fasting insulin and hemoglobin A1c.
What High Values Indicate
- Insulin resistance or metabolic syndrome
- Pre-diabetes or type 2 diabetes
- Chronic stress with elevated cortisol driving gluconeogenesis
- Excessive carbohydrate or sugar intake
- Pancreatic dysfunction
- Certain medications such as corticosteroids or thiazide diuretics
What Low Values Indicate
- Reactive hypoglycemia
- Adrenal insufficiency or HPA axis dysfunction
- Inadequate caloric intake or prolonged fasting beyond the recommended window
- Liver disease impairing glycogen storage and gluconeogenesis
- Excessive insulin production (insulinoma, rare)
BUN and Creatinine: Kidney Function Markers
BUN (Blood Urea Nitrogen) measures the amount of urea nitrogen in the blood. Urea is a waste product created when the liver breaks down protein. The kidneys filter urea from the blood, so elevated BUN can indicate impaired kidney filtration. However, BUN is also influenced by protein intake, hydration status, and liver function.
Conventional BUN range: 7 to 20 mg/dL
Functional optimal BUN range: 13 to 18 mg/dL
What High BUN Indicates
- Dehydration (one of the most common causes)
- Kidney dysfunction or kidney disease
- Excessive protein intake
- Upper gastrointestinal bleeding (blood is digested as protein)
- Congestive heart failure reducing renal blood flow
- Catabolic states such as severe infection or burns
What Low BUN Indicates
- Low protein intake or protein malabsorption
- Liver disease impairing urea synthesis
- Overhydration
- Celiac disease or other malabsorptive conditions
Creatinine is a waste product of creatine phosphate metabolism in muscle tissue. It is produced at a relatively constant rate and is filtered by the kidneys. Creatinine is considered a more reliable marker of kidney function than BUN because it is less influenced by diet and hydration.
Conventional creatinine range: 0.7 to 1.3 mg/dL for men; 0.6 to 1.1 mg/dL for women
Functional optimal creatinine range: 0.8 to 1.1 mg/dL
What High Creatinine Indicates
- Impaired kidney filtration or chronic kidney disease
- Dehydration
- High muscle mass (can physiologically elevate creatinine)
- Excessive creatine supplementation
- Rhabdomyolysis (muscle breakdown)
What Low Creatinine Indicates
- Low muscle mass or muscle wasting
- Malnutrition
- Advanced liver disease
- Pregnancy (due to increased renal blood flow)
BUN/Creatinine Ratio
The BUN/creatinine ratio is a calculated value that helps differentiate between causes of elevated BUN. It provides additional context beyond the individual values.
Normal ratio: 10:1 to 20:1
Functional optimal ratio: 10:1 to 16:1
Interpreting the Ratio
- Elevated ratio (greater than 20:1): Suggests pre-renal causes such as dehydration, high protein diet, gastrointestinal bleeding, or congestive heart failure. The kidneys themselves may be functioning normally, but reduced blood flow or increased urea production is driving BUN disproportionately higher than creatinine.
- Low ratio (less than 10:1): May indicate liver disease (reduced urea production), low protein intake, malnutrition, or rhabdomyolysis (creatinine rises disproportionately from muscle damage).
- Both BUN and creatinine elevated with a normal ratio: Suggests intrinsic kidney disease where both markers rise in proportion.
In functional medicine practice, a BUN/creatinine ratio consistently above 20:1 in the absence of kidney disease is a strong signal to assess hydration habits. Many patients are chronically under-hydrated, and this ratio often improves simply by increasing water intake.
eGFR: Estimated Glomerular Filtration Rate
The eGFR is not directly measured but calculated from serum creatinine, age, sex, and race using standardized formulas (most commonly the CKD-EPI equation). It estimates how well the kidneys are filtering blood and is the primary marker used to stage chronic kidney disease.
Conventional interpretation:
- Greater than 90 mL/min/1.73m2: Normal kidney function
- 60 to 89: Mildly decreased (Stage 2 CKD)
- 45 to 59: Mild to moderate decrease (Stage 3a CKD)
- 30 to 44: Moderate to severe decrease (Stage 3b CKD)
- 15 to 29: Severely decreased (Stage 4 CKD)
- Less than 15: Kidney failure (Stage 5 CKD)
Functional optimal range: Greater than 90 mL/min/1.73m2
It is important to note that eGFR has limitations. It can underestimate kidney function in people with high muscle mass and overestimate it in those with low muscle mass or advanced age. A single low eGFR reading does not necessarily indicate kidney disease; it must be confirmed with repeat testing over three or more months.
What Low eGFR Indicates
- Chronic kidney disease at various stages
- Acute kidney injury
- Reduced renal blood flow from dehydration or heart failure
- Long-term use of nephrotoxic medications (NSAIDs, certain antibiotics)
- Uncontrolled hypertension or diabetes damaging the nephrons
Electrolytes: Sodium, Potassium, Chloride, and CO2
The electrolyte panel within the CMP evaluates four critical minerals that regulate fluid balance, nerve conduction, muscle contraction, and acid-base equilibrium.
Sodium
Conventional range: 136 to 145 mEq/L
Functional optimal range: 138 to 142 mEq/L
- High sodium (hypernatremia): Dehydration, excessive sodium intake, diabetes insipidus, Cushing syndrome, or certain medications.
- Low sodium (hyponatremia): Overhydration, SIADH (syndrome of inappropriate antidiuretic hormone), adrenal insufficiency, diuretic use, excessive sweating with water-only replacement, hypothyroidism, or liver cirrhosis.
Potassium
Conventional range: 3.5 to 5.0 mEq/L
Functional optimal range: 4.0 to 4.5 mEq/L
- High potassium (hyperkalemia): Kidney disease, adrenal insufficiency, metabolic acidosis, hemolysis during blood draw (a common false elevation), excessive supplementation, ACE inhibitors or potassium-sparing diuretics.
- Low potassium (hypokalemia): Diuretic use, chronic diarrhea or vomiting, low dietary intake, excessive aldosterone production, magnesium deficiency (magnesium is required for potassium retention), insulin administration, or alkalosis.
Chloride
Conventional range: 98 to 106 mEq/L
Functional optimal range: 100 to 106 mEq/L
- High chloride (hyperchloremia): Dehydration, metabolic acidosis (non-anion gap), excessive saline infusion, renal tubular acidosis, or diarrhea with bicarbonate loss.
- Low chloride (hypochloremia): Vomiting (loss of hydrochloric acid), metabolic alkalosis, SIADH, Addison disease, or chronic respiratory acidosis with compensation.
CO2 / Bicarbonate
Conventional range: 23 to 29 mEq/L
Functional optimal range: 25 to 28 mEq/L
- High CO2: Metabolic alkalosis (often from vomiting, antacid overuse, or hypokalemia), chronic respiratory acidosis with renal compensation (as in COPD).
- Low CO2: Metabolic acidosis (diabetic ketoacidosis, lactic acidosis, renal failure, diarrhea), chronic hyperventilation, or respiratory alkalosis. From a functional perspective, low CO2 may also suggest poor tissue oxygenation or chronic stress-related breathing patterns.
Electrolyte imbalances rarely occur in isolation. Evaluating sodium, potassium, chloride, and CO2 together as a pattern provides far more clinical insight than looking at any single value.
Calcium
The CMP measures total serum calcium, which includes both free (ionized) calcium and calcium bound to proteins, primarily albumin. Calcium plays essential roles in bone health, muscle contraction, nerve signaling, blood clotting, and enzyme function.
Conventional range: 8.5 to 10.5 mg/dL
Functional optimal range: 9.2 to 10.0 mg/dL
Because roughly 40 percent of total calcium is bound to albumin, the calcium value must always be interpreted alongside albumin. If albumin is low, total calcium will appear falsely low even if ionized calcium is normal. A corrected calcium formula adjusts for this: Corrected calcium = measured calcium + 0.8 x (4.0 - measured albumin).
What High Calcium Indicates
- Primary hyperparathyroidism (the most common cause of persistent mild hypercalcemia)
- Malignancy (certain cancers produce PTH-related peptide)
- Excessive vitamin D supplementation
- Granulomatous diseases (sarcoidosis, tuberculosis)
- Thiazide diuretic use
- Prolonged immobilization causing bone resorption
What Low Calcium Indicates
- Vitamin D deficiency (extremely common)
- Hypoparathyroidism
- Magnesium deficiency (magnesium is needed for PTH secretion)
- Chronic kidney disease (impaired vitamin D activation)
- Malabsorption syndromes
- Low albumin (pseudohypocalcemia, check corrected calcium)
Liver Enzymes: AST, ALT, and ALP
The three liver enzymes on the CMP provide a window into hepatocellular health and biliary function. While they are commonly called "liver function tests," they are technically markers of liver cell damage rather than true measures of liver function.
AST (Aspartate Aminotransferase)
Conventional range: 10 to 40 U/L
Functional optimal range: 10 to 26 U/L
AST is found in the liver, heart, skeletal muscle, kidneys, and red blood cells. Because it is present in multiple tissues, an elevated AST is not specific to the liver. Strenuous exercise, heart damage, muscle injury, and hemolysis can all raise AST.
ALT (Alanine Aminotransferase)
Conventional range: 7 to 56 U/L
Functional optimal range: 10 to 26 U/L
ALT is more liver-specific than AST and is considered the better marker for hepatocellular injury. When ALT is elevated, the liver should be the primary focus of investigation.
Interpreting AST and ALT Together
- Both mildly elevated: Non-alcoholic fatty liver disease (NAFLD), medication effects, chronic viral hepatitis, or metabolic syndrome.
- AST greater than ALT (ratio greater than 2:1): Suggests alcoholic liver disease or advanced liver fibrosis/cirrhosis.
- ALT greater than AST: More common in NAFLD, acute viral hepatitis, or drug-induced liver injury.
- Very low AST and ALT: May indicate vitamin B6 deficiency (B6 is a cofactor for both enzymes) or poor overall protein status.
ALP (Alkaline Phosphatase)
Conventional range: 44 to 147 U/L
Functional optimal range: 50 to 100 U/L
ALP is found primarily in the liver and bone, with smaller amounts in the intestines, kidneys, and placenta. It is a marker of biliary function and bone turnover.
- High ALP: Biliary obstruction, cholestasis, bone disorders (Paget disease, fracture healing, growing children), pregnancy, or vitamin D deficiency stimulating bone turnover.
- Low ALP: Zinc deficiency (zinc is a cofactor for ALP), magnesium deficiency, hypothyroidism, pernicious anemia, or malnutrition. Functionally, low ALP is a strong indicator to assess zinc status.
Total Protein and Albumin
Total protein measures the combined amount of albumin and globulins in the blood. Albumin, produced by the liver, makes up roughly 60 percent of total serum protein and serves as a marker of nutritional status, liver synthetic function, and inflammatory burden.
Total Protein
Conventional range: 6.0 to 8.3 g/dL
Functional optimal range: 6.9 to 7.4 g/dL
- High total protein: Chronic inflammation, chronic infections, multiple myeloma or other gammopathies, dehydration (hemoconcentration).
- Low total protein: Malnutrition, malabsorption, liver disease (reduced albumin production), nephrotic syndrome (protein loss in urine), chronic illness, or inflammatory states where albumin drops as a negative acute-phase reactant.
Albumin
Conventional range: 3.5 to 5.5 g/dL
Functional optimal range: 4.0 to 5.0 g/dL
- High albumin: Typically indicates dehydration rather than overproduction.
- Low albumin: Chronic inflammation (albumin is a negative acute-phase reactant and drops during inflammatory states), liver disease, malnutrition, nephrotic syndrome, protein-losing enteropathy, or burns.
The globulin fraction can be estimated by subtracting albumin from total protein. A high globulin level may suggest chronic infection, autoimmune activity, or liver disease. The albumin/globulin ratio (A/G ratio) provides additional insight: a ratio below 1.0 warrants further investigation for inflammatory or immune-mediated conditions.
Bilirubin
Total bilirubin measures the combined amount of unconjugated (indirect) and conjugated (direct) bilirubin in the blood. Bilirubin is a yellow pigment produced from the breakdown of hemoglobin in aging red blood cells. The liver conjugates bilirubin to make it water-soluble for excretion in bile.
Conventional range: 0.1 to 1.2 mg/dL
Functional optimal range: 0.3 to 0.9 mg/dL
What High Bilirubin Indicates
- Gilbert syndrome: A benign genetic condition affecting roughly 5 to 10 percent of the population, causing mild unconjugated hyperbilirubinemia that fluctuates with stress, fasting, and illness. This is the most common cause of mildly elevated total bilirubin in otherwise healthy individuals.
- Hemolytic anemia: Increased red blood cell destruction producing excess unconjugated bilirubin.
- Liver disease: Hepatitis, cirrhosis, or drug-induced liver injury impairing conjugation.
- Biliary obstruction: Gallstones or tumors blocking bile flow, elevating conjugated bilirubin.
- Ineffective erythropoiesis: Conditions such as vitamin B12 or folate deficiency where red blood cell precursors are destroyed before maturing.
What Low Bilirubin Indicates
- Low bilirubin is generally not clinically significant by conventional standards. However, emerging research suggests that bilirubin serves as a potent antioxidant, and very low levels may indicate reduced antioxidant capacity. Some functional practitioners view low bilirubin in the context of overall oxidative stress burden.
Interestingly, mildly elevated bilirubin (as seen in Gilbert syndrome) has been associated with reduced cardiovascular disease risk, likely due to bilirubin's antioxidant properties.
Common Patterns Seen on a CMP
One of the greatest advantages of the CMP is the ability to recognize patterns across multiple markers simultaneously. Isolated abnormalities may not tell the full story, but patterns provide powerful clinical clues.
Pre-Diabetic Pattern
- Fasting glucose in the 95 to 110 mg/dL range
- Mildly elevated ALT (fatty liver from insulin resistance)
- Elevated triglycerides if a lipid panel is run alongside
- Low CO2 may suggest mild metabolic acidosis
- BUN/creatinine ratio may be elevated if patient is chronically dehydrated from polyuria
This pattern is extremely common and represents an opportunity for early intervention. Dietary modification, blood sugar management, and exercise can reverse the trajectory before type 2 diabetes develops.
Dehydration Pattern
- Elevated BUN with normal or mildly elevated creatinine
- BUN/creatinine ratio greater than 20:1
- High-normal or elevated sodium
- Elevated total protein and albumin (hemoconcentration)
- Elevated chloride
- Elevated calcium (concentrated in low-volume blood)
Chronic subclinical dehydration is remarkably common and can distort multiple CMP values. Always consider hydration status when interpreting results.
Liver Stress Pattern
- Elevated ALT, with or without elevated AST
- Elevated ALP if biliary involvement is present
- Elevated bilirubin
- Low albumin if liver synthetic function is compromised
- Low BUN if urea cycle function is impaired
- Elevated globulin (immune activation common in liver disease)
Mild AST/ALT elevations in the 30 to 60 U/L range are commonly seen with non-alcoholic fatty liver disease, which affects an estimated 25 to 30 percent of adults. This pattern should prompt assessment of insulin resistance, alcohol intake, medication burden, and environmental toxin exposure.
Kidney Dysfunction Pattern
- Elevated BUN and creatinine with a normal ratio
- Low eGFR
- Elevated potassium (kidneys cannot excrete it efficiently)
- Low CO2 / bicarbonate (metabolic acidosis from impaired acid excretion)
- Elevated phosphorus (if measured on a separate panel)
- Low calcium (impaired vitamin D activation in the kidneys)
When this pattern is identified, urgent follow-up including urinalysis, urine albumin-to-creatinine ratio, and renal ultrasound is recommended.
Natural Support Strategies
From a naturopathic and functional medicine perspective, CMP abnormalities often respond well to foundational interventions targeting root causes. The following strategies are not intended to replace medical treatment for serious conditions but can support overall metabolic health.
Hydration Optimization
- Aim for half your body weight in ounces of filtered water daily as a baseline
- Add a pinch of unrefined sea salt or mineral drops to water to enhance electrolyte balance and cellular hydration
- Reduce caffeine and alcohol, both of which promote diuresis
- Include water-rich foods such as cucumbers, watermelon, celery, and bone broth
- Monitor urine color as a practical hydration indicator (pale yellow is ideal)
Liver-Supportive Herbs and Nutrients
- Milk thistle (Silybum marianum): The most well-researched hepatoprotective herb. Silymarin, its active compound, supports glutathione production, reduces oxidative stress in hepatocytes, and may help lower elevated AST and ALT.
- Dandelion root (Taraxacum officinale): Supports bile flow and gentle liver detoxification. Can be taken as tea or tincture.
- Turmeric / Curcumin: Potent anti-inflammatory that supports phase II liver detoxification. Best absorbed with piperine or in liposomal form.
- N-Acetyl Cysteine (NAC): A precursor to glutathione, the liver's master antioxidant. Doses of 600 to 1200 mg daily can support liver detoxification pathways.
- B vitamins: Especially B6, B12, and folate, which are critical cofactors for liver enzyme function and methylation pathways.
- Burdock root (Arctium lappa): Traditional liver and blood-cleansing herb with antioxidant properties.
Blood Sugar Management
- Prioritize protein and healthy fats at every meal to slow glucose absorption
- Reduce refined carbohydrates and added sugars
- Incorporate chromium-rich foods (broccoli, green beans, grass-fed beef) or supplement with chromium picolinate (200 to 400 mcg daily)
- Berberine (500 mg two to three times daily with meals) has demonstrated efficacy comparable to metformin in some studies for lowering fasting glucose and improving insulin sensitivity
- Cinnamon (Ceylon variety) may modestly improve insulin sensitivity
- Regular physical activity, especially resistance training and post-meal walking, significantly improves glucose regulation
- Prioritize 7 to 9 hours of quality sleep, as sleep deprivation impairs insulin sensitivity within days
Kidney Support
- Maintain adequate hydration as the single most important strategy
- Reduce excessive protein intake if BUN is persistently elevated
- Control blood pressure and blood sugar, the two leading causes of kidney damage
- Avoid chronic NSAID use, which can impair renal blood flow
- Consider astragalus (Astragalus membranaceus), which has demonstrated renoprotective effects in traditional Chinese medicine and modern research
- Omega-3 fatty acids may reduce renal inflammation
Electrolyte Balance
- Eat a diet rich in potassium (avocados, sweet potatoes, leafy greens, bananas) rather than relying solely on supplements
- Ensure adequate magnesium intake (400 to 600 mg daily), as magnesium deficiency can drive potassium and calcium imbalances
- Use unrefined salt (Celtic sea salt, Himalayan pink salt) for trace mineral content
- Address chronic stress and cortisol dysregulation, which can disrupt sodium-potassium balance via aldosterone
When to Retest
The frequency of CMP retesting depends on the clinical context and the severity of any abnormalities found.
- Normal results with no concerns: Retest annually as part of routine health screening.
- Mild functional imbalances (values within conventional range but outside optimal): Implement dietary and lifestyle changes and retest in 8 to 12 weeks to assess the impact of interventions.
- Moderate abnormalities (values outside conventional range): Retest in 4 to 6 weeks, especially if new interventions or medications have been initiated.
- Significant abnormalities (markedly elevated liver enzymes, low eGFR, severe electrolyte imbalances): Retest within 1 to 2 weeks or sooner depending on clinical severity. These situations may require urgent medical management.
- Monitoring chronic conditions: Every 3 to 6 months for conditions such as chronic kidney disease, diabetes, or liver disease.
- Post-intervention follow-up: After starting a new supplement protocol or making significant dietary changes, 6 to 8 weeks is generally sufficient to see meaningful shifts in CMP markers.
Always request a fasting draw for consistency. Ideally, test at the same time of day and under similar conditions (same lab, same fasting duration) to minimize variability and allow accurate comparison over time.
Related Tests for Deeper Investigation
While the CMP provides an excellent broad overview, it has limitations. The following tests can be added to a CMP to build a more complete picture of metabolic health.
- Fasting Insulin: Essential for detecting insulin resistance years before fasting glucose becomes abnormal. Functional optimal range is 2 to 6 uIU/mL. When combined with fasting glucose, the HOMA-IR index can be calculated to quantify insulin resistance.
- Hemoglobin A1c (HbA1c): Reflects average blood sugar over the previous 2 to 3 months. Functional optimal range is 4.8 to 5.2 percent. Provides a more complete picture than a single fasting glucose.
- GGT (Gamma-Glutamyl Transferase): A sensitive marker of liver stress, particularly from alcohol, medications, and oxidative stress. Also reflects glutathione demand. Not included in the standard CMP but highly valuable.
- Phosphorus: Important for evaluating parathyroid function and kidney disease alongside calcium. Often run separately.
- Magnesium (serum and/or RBC): Serum magnesium is a poor indicator of total body stores since only 1 percent of magnesium is in the blood. RBC magnesium is more reflective of intracellular status.
- Uric Acid: Elevated levels are associated with gout, metabolic syndrome, kidney stone risk, and cardiovascular disease. A useful addition to the metabolic assessment.
- Urinalysis with Microalbumin: Essential for detecting early kidney damage not yet reflected in serum creatinine or eGFR.
- Complete Blood Count (CBC): Complements the CMP by providing information on red blood cells, white blood cells, and platelets. Together, a CMP and CBC form the foundation of a comprehensive blood panel.
- Lipid Panel: Total cholesterol, LDL, HDL, triglycerides, and ideally LDL particle number and size. Metabolic syndrome often presents with CMP abnormalities alongside dyslipidemia.
- Vitamin D (25-OH): Critical for calcium interpretation and overall metabolic health. Functional optimal range is 50 to 80 ng/mL.
- Liver Function Panel (direct and indirect bilirubin, LDH): When total bilirubin is elevated, fractionation helps distinguish between hepatocellular, hemolytic, and obstructive causes.
- Cystatin C: An alternative marker for estimating GFR that is not influenced by muscle mass. Useful when creatinine-based eGFR may be inaccurate.
In clinical practice, ordering a CMP alongside a CBC, lipid panel, fasting insulin, HbA1c, vitamin D, and GGT provides a remarkably thorough metabolic assessment at a reasonable cost. This combination allows for early detection of insulin resistance, fatty liver, kidney stress, and nutritional deficiencies long before they progress to diagnosable disease.
Research Papers and References
The following are curated PubMed literature searches covering the evidence base for comprehensive metabolic panel testing, interpretation, and clinical management. Each link opens a live, filtered PubMed query so the results stay current as new studies are indexed.
- Comprehensive metabolic panel interpretation — PubMed literature search
- eGFR CKD-EPI equation — PubMed literature search
- BUN creatinine ratio — PubMed literature search
- ALT AST liver enzymes — PubMed literature search
- Hyperkalemia management — PubMed literature search
- Hyponatremia evaluation — PubMed literature search
- Anion gap metabolic acidosis — PubMed literature search
- Serum albumin prognosis — PubMed literature search
- Alkaline phosphatase elevation — PubMed literature search
- Fasting glucose prediabetes — PubMed literature search
External Authoritative Resources
- MedlinePlus — Laboratory Tests Reference
- Lab Tests Online — Patient-Oriented Lab Test Reference (AACC)
- StatPearls / NCBI Bookshelf — Clinical Laboratory Reference
Connections
- Kidney Nephron — interactive animation
- Complete Blood Count
- Hemoglobin A1C
- Urinalysis
- Kidney Function
- BUN
- Creatinine
- eGFR
- Kidney Disease
- Liver Disease
- Fatty Liver Disease
- Potassium
- Calcium
- Magnesium
- Diabetes
- Insulin Resistance
- Blood Sugar
- GGT
- Liver Cleansing