Lipid Panel
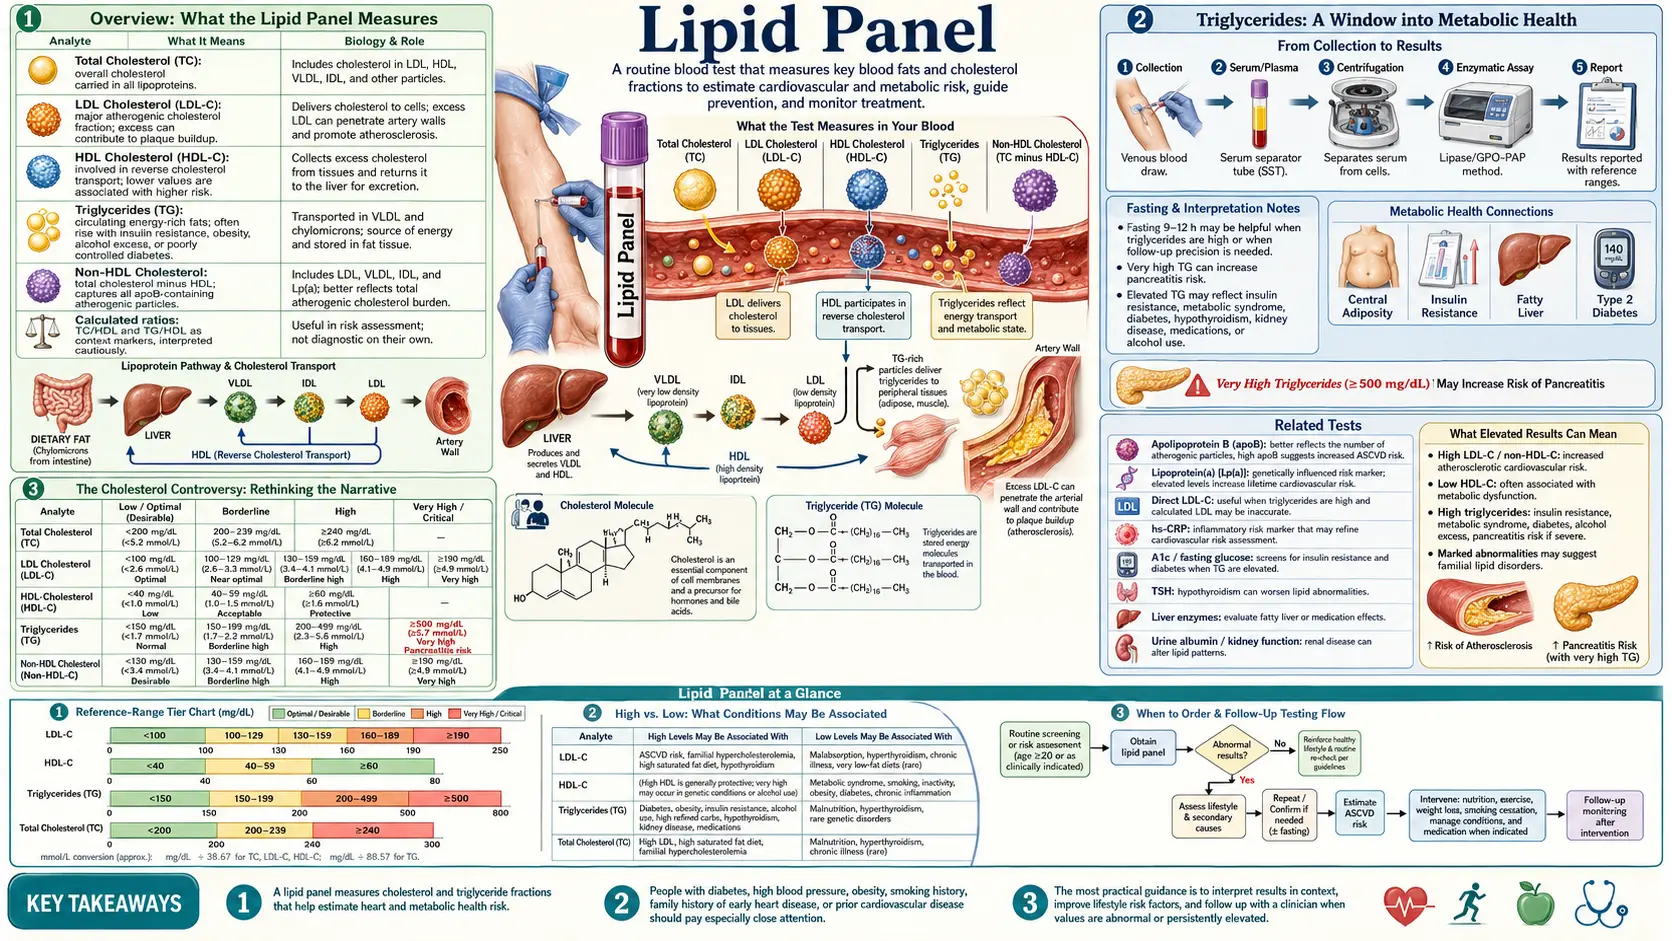


Table of Contents
- Overview: What the Lipid Panel Measures
- Total Cholesterol: Conventional vs Functional Optimal Ranges
- LDL Cholesterol: Calculated vs Direct and Particle Size
- HDL Cholesterol: The Protective Lipoprotein
- Triglycerides: A Window into Metabolic Health
- VLDL Cholesterol
- Key Ratios: What They Reveal About Cardiovascular Risk
- Advanced Lipid Testing: Beyond the Standard Panel
- The Cholesterol Controversy: Rethinking the Narrative
- Natural Strategies for Improving Lipid Markers
- Statin Considerations: Weighing Benefits and Risks
- When to Retest
- Related Tests
- Featured Videos
Overview: What the Lipid Panel Measures
The lipid panel, also called a lipid profile or lipid screen, is one of the most commonly ordered blood tests in clinical practice. It provides a snapshot of the fats and fat-like substances circulating in the bloodstream. A standard lipid panel typically measures four primary markers: total cholesterol, LDL cholesterol (low-density lipoprotein), HDL cholesterol (high-density lipoprotein), and triglycerides. Some laboratories also calculate VLDL cholesterol (very low-density lipoprotein) as part of the standard report.
From a functional medicine perspective, the lipid panel is a starting point, not an endpoint, for assessing cardiovascular risk. While conventional medicine often focuses narrowly on LDL cholesterol as the primary driver of heart disease, a naturopathic and functional approach recognizes that lipid metabolism is far more nuanced. The context in which these numbers exist matters tremendously: inflammation, insulin resistance, thyroid function, nutrient status, and oxidative stress all influence what the lipid numbers actually mean for an individual patient.
The test is typically performed after a 9 to 12 hour fast, though recent guidelines suggest that non-fasting samples may be acceptable for initial screening. Fasting samples remain the gold standard for accurate triglyceride measurement and for calculating LDL cholesterol using the Friedewald equation. Blood is drawn from a vein, usually in the arm, and results are generally available within 24 to 48 hours.
Total Cholesterol: Conventional vs Functional Optimal Ranges
Total cholesterol represents the sum of all cholesterol carried in the blood, including LDL, HDL, VLDL, and other lipoprotein fractions. Conventional medicine classifies total cholesterol as follows:
- Desirable: Less than 200 mg/dL
- Borderline high: 200 to 239 mg/dL
- High: 240 mg/dL and above
However, these cutoffs deserve scrutiny. From a functional medicine standpoint, an optimal total cholesterol range is often considered to be between 180 and 250 mg/dL, depending on the full clinical picture. Total cholesterol below 150 mg/dL has been associated with increased risk of depression, hormonal insufficiency, cognitive decline, and even increased mortality in elderly populations. Cholesterol is not merely a harmful substance to be driven as low as possible. It is a vital building block for cell membranes, a precursor for steroid hormones (including cortisol, estrogen, progesterone, testosterone, and DHEA), a precursor for vitamin D synthesis, and an essential component of bile acids needed for fat digestion and detoxification.
Why total cholesterol alone is misleading: A person with a total cholesterol of 240 mg/dL who has high HDL, low triglycerides, and predominantly large buoyant LDL particles may have a far lower cardiovascular risk than someone with a total cholesterol of 190 mg/dL who has low HDL, high triglycerides, and small dense LDL particles. Total cholesterol is simply too blunt a measurement to serve as a reliable standalone indicator of heart disease risk. The composition and context of the cholesterol matter far more than the aggregate number.
It is also worth noting that total cholesterol naturally rises with age, particularly in women after menopause, and may fluctuate with seasons, stress levels, acute illness, and thyroid function. A single elevated reading should always be confirmed and interpreted within the broader clinical context.
LDL Cholesterol: Calculated vs Direct and Particle Size
LDL cholesterol has been labeled "bad cholesterol" in popular discourse, but this oversimplification obscures critical nuances. On a standard lipid panel, LDL is typically not measured directly. Instead, it is calculated using the Friedewald equation:
LDL = Total Cholesterol - HDL - (Triglycerides / 5)
This calculation becomes increasingly inaccurate when triglycerides exceed 200 mg/dL and is considered unreliable above 400 mg/dL. In patients with high triglycerides, the calculated LDL may significantly underestimate or overestimate the true LDL value. Direct LDL measurement is available and should be considered when triglycerides are elevated or when more precision is needed.
Conventional reference ranges for LDL cholesterol include:
- Optimal: Less than 100 mg/dL
- Near optimal: 100 to 129 mg/dL
- Borderline high: 130 to 159 mg/dL
- High: 160 to 189 mg/dL
- Very high: 190 mg/dL and above
Functional medicine practitioners often consider an optimal LDL range of 80 to 130 mg/dL, recognizing that very low LDL levels may carry their own risks, including impaired hormone production and immune function.
Particle Size Matters: Small Dense vs Large Buoyant LDL
Perhaps the most important insight from modern lipid research is that not all LDL particles are created equal. LDL particles exist on a spectrum from small, dense particles (Pattern B) to large, buoyant particles (Pattern A):
- Small dense LDL (Pattern B): These particles are highly atherogenic. They penetrate the arterial wall more easily, are more susceptible to oxidation, remain in circulation longer, and are strongly associated with insulin resistance, metabolic syndrome, and type 2 diabetes. A person with predominantly small dense LDL is at significantly higher cardiovascular risk regardless of their total LDL number.
- Large buoyant LDL (Pattern A): These larger particles are far less likely to contribute to plaque formation. They are less oxidizable, clear from the bloodstream more efficiently, and are associated with a more favorable metabolic profile. A person whose LDL is predominantly large and buoyant may have a seemingly elevated LDL number yet carry relatively low cardiovascular risk.
Standard lipid panels do not differentiate between these particle types. Advanced testing through NMR LipoProfile or ion mobility analysis is required to determine LDL particle size distribution. This distinction is one of the primary reasons why the standard lipid panel, taken in isolation, can be a poor predictor of cardiovascular events.
HDL Cholesterol: The Protective Lipoprotein
HDL cholesterol is often called "good cholesterol" because of its role in reverse cholesterol transport, the process by which excess cholesterol is removed from arterial walls and peripheral tissues and transported back to the liver for recycling or excretion. HDL also possesses anti-inflammatory, antioxidant, and anticlotting properties that contribute to cardiovascular protection.
Conventional reference ranges classify HDL as follows:
- Low (increased risk): Less than 40 mg/dL in men, less than 50 mg/dL in women
- Desirable: 40 to 59 mg/dL
- Optimal (protective): 60 mg/dL and above
From a functional medicine perspective, optimal HDL levels are generally considered to be 55 to 70 mg/dL for men and 65 to 80 mg/dL for women. Extremely high HDL (above 90 to 100 mg/dL) is not always protective and may in some cases reflect dysfunctional HDL that has lost its anti-inflammatory and reverse transport capacity. Recent research has identified that HDL functionality, not just HDL quantity, determines its protective value.
Low HDL is one of the most consistent markers of metabolic dysfunction and is frequently seen alongside insulin resistance, central obesity, sedentary lifestyle, smoking, and a diet high in refined carbohydrates and trans fats. Raising HDL through lifestyle interventions is far more effective and beneficial than pharmaceutical approaches. Regular aerobic exercise, moderate alcohol consumption, adequate omega-3 fatty acid intake, and weight loss are among the most effective strategies for increasing HDL levels naturally.
Triglycerides: A Window into Metabolic Health
Triglycerides are the most abundant form of fat in the body and serve as a major energy storage molecule. They are formed from dietary fats as well as from excess carbohydrates, sugars, and alcohol that the liver converts into fat. Triglyceride levels are perhaps the most metabolically revealing number on the standard lipid panel.
Conventional reference ranges for triglycerides:
- Normal: Less than 150 mg/dL
- Borderline high: 150 to 199 mg/dL
- High: 200 to 499 mg/dL
- Very high: 500 mg/dL and above
Functional medicine optimal range for triglycerides is significantly tighter: 50 to 100 mg/dL. Levels above 100 mg/dL begin to suggest metabolic inefficiency, and levels above 150 mg/dL are a strong signal of insulin resistance, even when fasting glucose appears normal.
The Link to Insulin Resistance
Elevated triglycerides are one of the earliest and most sensitive markers of insulin resistance and metabolic syndrome. When cells become resistant to insulin, the liver compensates by producing more VLDL particles (which carry triglycerides), leading to elevated circulating triglyceride levels. This relationship is so consistent that triglyceride levels are often used as a surrogate marker for insulin sensitivity in clinical practice.
The dietary driver of elevated triglycerides is overwhelmingly excess carbohydrate intake, particularly refined carbohydrates, sugar, fructose, and alcohol, rather than dietary fat. This is a critical distinction that conventional dietary advice has historically gotten backwards. Reducing refined carbohydrates and sugars is typically the single most effective intervention for lowering triglycerides, often producing dramatic reductions within weeks.
Triglyceride levels above 500 mg/dL carry a risk of acute pancreatitis and require more urgent intervention. Other causes of elevated triglycerides include hypothyroidism, kidney disease, certain medications (including beta-blockers, thiazide diuretics, oral estrogen, and retinoids), and genetic conditions such as familial hypertriglyceridemia.
VLDL Cholesterol
VLDL (very low-density lipoprotein) is produced by the liver and serves as the primary vehicle for transporting triglycerides from the liver to peripheral tissues. VLDL particles are triglyceride-rich and, as they deliver their triglyceride cargo, they are progressively converted into intermediate-density lipoprotein (IDL) and eventually into LDL particles.
On a standard lipid panel, VLDL is typically estimated rather than directly measured, using the formula:
VLDL = Triglycerides / 5
The conventional normal range for VLDL is 5 to 30 mg/dL. Functional optimal is generally considered to be below 20 mg/dL. Because VLDL is derived from triglycerides, elevated VLDL tracks closely with elevated triglycerides and carries the same metabolic implications regarding insulin resistance and carbohydrate metabolism.
VLDL remnant particles are increasingly recognized as independently atherogenic. These remnant particles can penetrate the arterial wall and contribute to plaque formation. Elevated VLDL and remnant cholesterol may help explain cardiovascular events that occur in patients whose LDL appears to be at goal, a phenomenon sometimes called "residual risk."
Key Ratios: What They Reveal About Cardiovascular Risk
While individual lipid values provide useful information, certain ratios derived from the lipid panel are often more predictive of cardiovascular risk than any single number. Functional medicine practitioners routinely calculate and monitor these ratios.
Triglyceride to HDL Ratio (TG/HDL)
The triglyceride to HDL ratio is arguably the single most useful number that can be derived from a standard lipid panel. It serves as a powerful surrogate marker for insulin resistance, LDL particle size, and cardiovascular risk:
- Optimal: Less than 1.0 (strongly favorable metabolic profile)
- Acceptable: 1.0 to 2.0
- Concerning: 2.0 to 3.0 (suggestive of insulin resistance)
- High risk: Greater than 3.0 (strongly associated with insulin resistance, small dense LDL predominance, and increased cardiovascular risk)
A TG/HDL ratio below 2.0 strongly predicts large buoyant LDL particle predominance (Pattern A), while a ratio above 3.0 strongly predicts small dense LDL predominance (Pattern B). This simple calculation provides insight into LDL particle size without the need for expensive advanced testing and is one of the most cost-effective tools in cardiovascular risk assessment.
Total Cholesterol to HDL Ratio (TC/HDL)
The total cholesterol to HDL ratio provides a broader view of lipid balance and cardiovascular risk:
- Optimal: Less than 3.5
- Acceptable: 3.5 to 5.0
- Elevated risk: Greater than 5.0
This ratio captures the balance between potentially atherogenic lipoproteins and protective HDL. A person with a total cholesterol of 250 mg/dL and an HDL of 80 mg/dL (ratio of 3.1) is at considerably lower risk than a person with total cholesterol of 200 mg/dL and an HDL of 35 mg/dL (ratio of 5.7).
LDL to HDL Ratio
The LDL to HDL ratio offers another lens on atherogenic risk. An optimal LDL/HDL ratio is below 2.5 for men and below 2.0 for women. Values above 3.5 indicate significant cardiovascular risk regardless of individual LDL or HDL values.
Advanced Lipid Testing: Beyond the Standard Panel
When a more detailed assessment of cardiovascular risk is needed, advanced lipid testing provides information that the standard panel simply cannot capture. Functional medicine practitioners frequently order these tests, particularly for patients with a family history of heart disease, metabolic syndrome, or lipid values that do not seem to match their clinical picture.
LDL Particle Number (LDL-P)
LDL particle number measures the actual count of LDL particles circulating in the blood, as opposed to the cholesterol content carried within those particles (which is what standard LDL-C measures). Research has consistently shown that LDL-P is a stronger predictor of cardiovascular events than LDL-C. Two patients can have identical LDL-C values yet dramatically different LDL-P counts, leading to very different risk profiles. An optimal LDL-P is generally below 1000 nmol/L, with levels above 1300 nmol/L indicating elevated risk. LDL-P is measured via NMR LipoProfile testing.
Lipoprotein(a) - Lp(a)
Lipoprotein(a) is a genetically determined lipoprotein that is structurally similar to LDL but includes an additional protein called apolipoprotein(a). Elevated Lp(a) is an independent and potent risk factor for atherosclerosis, heart attack, stroke, and aortic valve stenosis. Lp(a) levels are largely determined by genetics and are minimally affected by diet or lifestyle interventions. Approximately 20 percent of the population carries elevated Lp(a). Optimal levels are below 30 mg/dL (or below 75 nmol/L). Because Lp(a) is genetically fixed, it only needs to be tested once in a lifetime, though knowing your level is essential for comprehensive risk assessment. Niacin (vitamin B3) is one of the few agents that has been shown to modestly reduce Lp(a).
Apolipoprotein B (ApoB)
ApoB is the primary protein found on all atherogenic lipoprotein particles, including LDL, VLDL, IDL, and Lp(a). Because each atherogenic particle contains exactly one ApoB molecule, ApoB provides a direct count of total atherogenic particles. Many researchers and clinicians now consider ApoB to be the single best lipid-related predictor of cardiovascular risk. Optimal ApoB levels are below 80 mg/dL, with levels above 100 mg/dL indicating elevated risk.
Oxidized LDL (OxLDL)
Oxidized LDL represents LDL particles that have undergone oxidative damage. It is oxidized LDL, not native LDL, that triggers the inflammatory cascade leading to atherosclerotic plaque formation. When LDL particles become oxidized, they are taken up by macrophages in the arterial wall, forming foam cells, which are the hallmark of early atherosclerosis. Measuring oxidized LDL provides direct insight into the degree of oxidative stress affecting lipid metabolism. Elevated oxidized LDL suggests the need for antioxidant support, anti-inflammatory strategies, and investigation of oxidative stress sources such as smoking, environmental toxins, poor diet, and chronic infection.
The Cholesterol Controversy: Rethinking the Narrative
The conventional narrative that high cholesterol directly causes heart disease has been increasingly challenged by researchers and clinicians over the past two decades. While there is no doubt that atherosclerosis involves cholesterol deposition in arterial walls, the simplistic model of "high cholesterol equals heart disease" fails to account for numerous observations and contradictions in the scientific literature.
Why High Cholesterol Is Not Always Bad
Multiple large epidemiological studies have demonstrated that in elderly populations (over age 60 to 65), higher total cholesterol is paradoxically associated with lower all-cause mortality. This "cholesterol paradox" has been observed in studies from Japan, Europe, and the United States. Additionally, roughly half of all heart attacks occur in people with normal or low cholesterol levels, and many people with elevated cholesterol never develop heart disease.
Cholesterol serves essential physiological functions that must not be overlooked:
- Cell membrane integrity: Every cell in the body requires cholesterol for membrane structure and fluidity
- Hormone production: Cholesterol is the precursor molecule for cortisol, aldosterone, estrogen, progesterone, testosterone, and DHEA
- Vitamin D synthesis: Cholesterol in the skin is converted to vitamin D upon UV exposure
- Bile acid production: Essential for fat digestion and toxin elimination
- Brain function: The brain contains approximately 25 percent of the body's cholesterol, essential for synapse formation and neurotransmitter function
- Immune function: LDL particles bind and neutralize bacterial toxins and support immune surveillance
The Role of Inflammation
A growing body of evidence suggests that chronic inflammation, not cholesterol per se, is the primary driver of atherosclerotic cardiovascular disease. Cholesterol becomes problematic primarily when it is deposited in arterial walls that are already inflamed and damaged. The inflammatory model of heart disease explains why markers like high-sensitivity C-reactive protein (hs-CRP), homocysteine, fibrinogen, and oxidized LDL are often better predictors of cardiovascular events than LDL cholesterol alone.
From a naturopathic perspective, addressing the root causes of inflammation (including poor diet, blood sugar dysregulation, chronic infections, environmental toxins, stress, and gut dysbiosis) is a more rational and effective strategy for reducing cardiovascular risk than simply driving cholesterol numbers down with medication.
Natural Strategies for Improving Lipid Markers
Naturopathic and functional medicine offer a rich array of evidence-based strategies for optimizing lipid profiles. These interventions address root causes rather than merely suppressing numbers, and they often improve the overall metabolic landscape simultaneously.
Omega-3 Fatty Acids
Omega-3 fatty acids (EPA and DHA) from fish oil or algae-based sources are among the most effective natural interventions for lipid optimization. They lower triglycerides by 15 to 30 percent at therapeutic doses (2 to 4 grams of combined EPA/DHA daily), reduce inflammation, decrease oxidized LDL, improve HDL functionality, and shift LDL particle size toward the large buoyant pattern. Wild-caught fatty fish (salmon, sardines, mackerel, anchovies) consumed 3 to 4 times weekly also provides significant benefit.
Niacin (Vitamin B3)
Niacin is the most effective natural agent for raising HDL cholesterol, with increases of 15 to 35 percent at therapeutic doses (1000 to 2000 mg daily of immediate-release or extended-release formulations). Niacin also lowers triglycerides by 20 to 50 percent, reduces LDL particle number, shifts LDL toward the large buoyant pattern, and is one of the few substances that lowers Lp(a) by 10 to 30 percent. The flushing side effect can be mitigated by starting with low doses and gradually titrating upward, taking with food, and using extended-release formulations. Niacin should be monitored with liver function tests when used at therapeutic doses.
Soluble Fiber
Soluble fiber from sources such as oats, psyllium husk, ground flaxseed, chia seeds, beans, lentils, and vegetables binds bile acids in the gut, forcing the liver to use cholesterol to make new bile acids and thereby lowering circulating LDL by 5 to 15 percent. A daily intake of 10 to 25 grams of soluble fiber is recommended. Psyllium husk (5 to 10 grams daily) is a convenient supplemental option.
Exercise
Regular physical activity is one of the most powerful interventions for lipid optimization. Aerobic exercise raises HDL by 5 to 15 percent, lowers triglycerides by 10 to 30 percent, shifts LDL toward the large buoyant pattern, and improves insulin sensitivity. Both moderate-intensity continuous training (brisk walking, cycling, swimming for 150 or more minutes per week) and high-intensity interval training (HIIT) have demonstrated significant lipid benefits. Resistance training also contributes to improved metabolic health and lipid profiles.
Reducing Refined Carbohydrates and Sugar
Excess refined carbohydrate and sugar consumption is the single greatest dietary driver of dyslipidemia, particularly the pattern of high triglycerides, low HDL, and small dense LDL known as atherogenic dyslipidemia. Reducing or eliminating refined grains, added sugars, high-fructose corn syrup, fruit juice, and excess alcohol produces rapid and often dramatic improvements in triglycerides and HDL. A whole-foods diet emphasizing vegetables, quality proteins, healthy fats, nuts, seeds, and moderate amounts of whole grains and fruit provides the foundation for optimal lipid metabolism.
Additional Natural Interventions
- Plant sterols and stanols: 2 grams daily can lower LDL by 5 to 15 percent by blocking intestinal cholesterol absorption
- Red yeast rice: Contains naturally occurring monacolin K (identical to lovastatin), can lower LDL by 15 to 25 percent. Quality and potency vary significantly between products
- Berberine: 500 mg two to three times daily has been shown to lower LDL by 20 to 30 percent, reduce triglycerides, and improve insulin sensitivity
- Coenzyme Q10: 100 to 300 mg daily supports mitochondrial function and is essential to supplement when taking statins or red yeast rice, which deplete CoQ10
- Garlic extract (aged): Modest LDL-lowering effect and antiplatelet activity
- Green tea or EGCG: Antioxidant support, modest LDL-lowering and triglyceride-lowering effects
- Curcumin: Anti-inflammatory, reduces oxidized LDL, supports healthy lipid metabolism
- Magnesium: Adequate magnesium status supports healthy lipid metabolism and insulin sensitivity. Many Americans are deficient
Statin Considerations: Weighing Benefits and Risks
Statin medications (atorvastatin, rosuvastatin, simvastatin, pravastatin, and others) are the most widely prescribed class of cholesterol-lowering drugs. They work by inhibiting HMG-CoA reductase, the rate-limiting enzyme in cholesterol synthesis. While statins effectively lower LDL cholesterol by 30 to 50 percent or more, their use requires careful consideration of both benefits and risks.
Potential benefits of statins: Statins have demonstrated the clearest benefit in secondary prevention, meaning in patients who have already had a cardiovascular event (heart attack, stroke, or documented atherosclerotic disease). In this population, the evidence for reduced recurrence and mortality is robust. Much of this benefit may stem from statins' anti-inflammatory properties rather than their cholesterol-lowering effect per se. For primary prevention (people who have not yet had an event), the benefit is considerably more modest, particularly in women and the elderly.
Potential risks and side effects include:
- Muscle pain and weakness (myalgia): Reported in 10 to 30 percent of patients in clinical practice, significantly higher than clinical trial rates suggest
- CoQ10 depletion: Statins block the same pathway that produces CoQ10, a critical mitochondrial nutrient. Supplementation with CoQ10 (100 to 300 mg daily) should be considered mandatory for any patient on a statin
- Increased diabetes risk: Statins increase the risk of new-onset type 2 diabetes by approximately 9 to 12 percent
- Cognitive effects: Some patients report memory issues, brain fog, or cognitive impairment on statins
- Liver enzyme elevation: Periodic monitoring of liver function is recommended
- Peripheral neuropathy: Rare but documented
- Hormonal effects: By reducing cholesterol, statins may affect steroid hormone production
A thorough shared decision-making process between practitioner and patient should weigh the individual's specific risk factors, the magnitude of expected benefit, the potential for side effects, and whether lifestyle and natural interventions have been adequately explored before initiating statin therapy. In many cases, particularly for primary prevention in lower-risk individuals, aggressive lifestyle modification and targeted supplementation can achieve meaningful lipid improvement without the need for pharmaceutical intervention.
When to Retest
The timing of lipid panel retesting depends on the clinical scenario and the interventions being employed:
- Baseline screening: Adults should have an initial lipid panel by age 20. Earlier screening is appropriate for those with a family history of premature cardiovascular disease or familial hypercholesterolemia
- After initiating lifestyle changes: Retest in 8 to 12 weeks. This allows sufficient time for dietary, exercise, and supplement interventions to manifest in blood levels
- After starting a new medication: Retest in 6 to 8 weeks to assess response and check for adverse effects (liver enzymes should also be monitored)
- Stable patients at goal: Annual retesting is generally sufficient
- Patients with active metabolic concerns: Every 3 to 6 months until goals are met and values are stable
- After significant weight loss or gain: Retest to reassess, as body composition changes significantly affect lipid metabolism
- After thyroid status changes: Hypothyroidism is a common and underappreciated cause of elevated cholesterol. Always recheck lipids after thyroid treatment adjustments
For the most accurate results, maintain consistent conditions between tests: fast for 9 to 12 hours, avoid alcohol for 24 to 48 hours prior, avoid vigorous exercise for 24 hours prior, and draw at approximately the same time of day. Acute illness, surgery, or major physiological stress can temporarily alter lipid values. Wait at least 6 weeks after an acute event before drawing lipids.
Related Tests
For a comprehensive cardiovascular and metabolic risk assessment, the lipid panel should be interpreted alongside several complementary tests:
- High-sensitivity C-reactive protein (hs-CRP): Measures systemic inflammation. Levels below 1.0 mg/L are optimal. Elevated hs-CRP in conjunction with dyslipidemia significantly amplifies cardiovascular risk
- Fasting insulin and glucose (with HOMA-IR calculation): Directly assesses insulin resistance, which is the metabolic root cause of atherogenic dyslipidemia in many patients
- Hemoglobin A1c: Reflects average blood sugar over 2 to 3 months and provides additional insight into glycemic control and metabolic health
- Homocysteine: Elevated levels indicate impaired methylation, B vitamin insufficiency, and independent cardiovascular risk
- Thyroid panel (TSH, free T3, free T4): Hypothyroidism is a common cause of elevated cholesterol and should always be ruled out before attributing dyslipidemia to diet or genetics alone
- Liver function tests (AST, ALT, GGT): Fatty liver disease is closely linked to dyslipidemia and insulin resistance
- Fibrinogen: A clotting factor and acute-phase reactant that contributes to cardiovascular risk independently of lipids
- Uric acid: Elevated levels are associated with metabolic syndrome, insulin resistance, and cardiovascular risk
- Vitamin D (25-OH): Low vitamin D status is associated with dyslipidemia and increased cardiovascular risk
- Omega-3 index: Measures the percentage of EPA and DHA in red blood cell membranes, reflecting long-term omega-3 status and cardiovascular protection
- Coronary artery calcium (CAC) score: A CT-based imaging test that directly visualizes calcium deposits in coronary arteries, providing a more direct assessment of atherosclerotic burden than any blood test
By combining the standard lipid panel with advanced lipid markers, inflammatory markers, and metabolic indicators, a truly comprehensive picture of cardiovascular risk emerges, one that goes far beyond the reductive approach of treating a single LDL number.
Research Papers and References
The following are curated PubMed literature searches covering the evidence base for lipid panel testing, interpretation, and clinical management. Each link opens a live, filtered PubMed query so the results stay current as new studies are indexed.
- LDL cholesterol cardiovascular risk — PubMed literature search
- HDL cholesterol function — PubMed literature search
- Triglycerides cardiovascular disease — PubMed literature search
- Small dense LDL particles — PubMed literature search
- Friedewald equation LDL — PubMed literature search
- Non-HDL cholesterol prognosis — PubMed literature search
- Triglyceride HDL ratio insulin — PubMed literature search
- Statin primary prevention — PubMed literature search
- PCSK9 inhibitor trials — PubMed literature search
- Saturated fat cardiovascular — PubMed literature search
External Authoritative Resources
- MedlinePlus — Laboratory Tests Reference
- Lab Tests Online — Patient-Oriented Lab Test Reference (AACC)
- StatPearls / NCBI Bookshelf — Clinical Laboratory Reference
Connections
- Cholesterol & the Artery Wall — interactive animation
- ApoB
- Lipoprotein(a)
- Coronary Calcium Score
- Inflammatory Markers
- Fasting Insulin
- Atherosclerosis
- Coronary Artery Disease
- Cardiovascular Disease
- Stroke
- Cholesterol Management
- Insulin Resistance
- Metabolic Syndrome
- Omega-3 Fatty Acids
- Berberine
- Garlic
- Niacin
- Magnesium
- Fasting