FRAX Risk Assessment and Treatment Thresholds
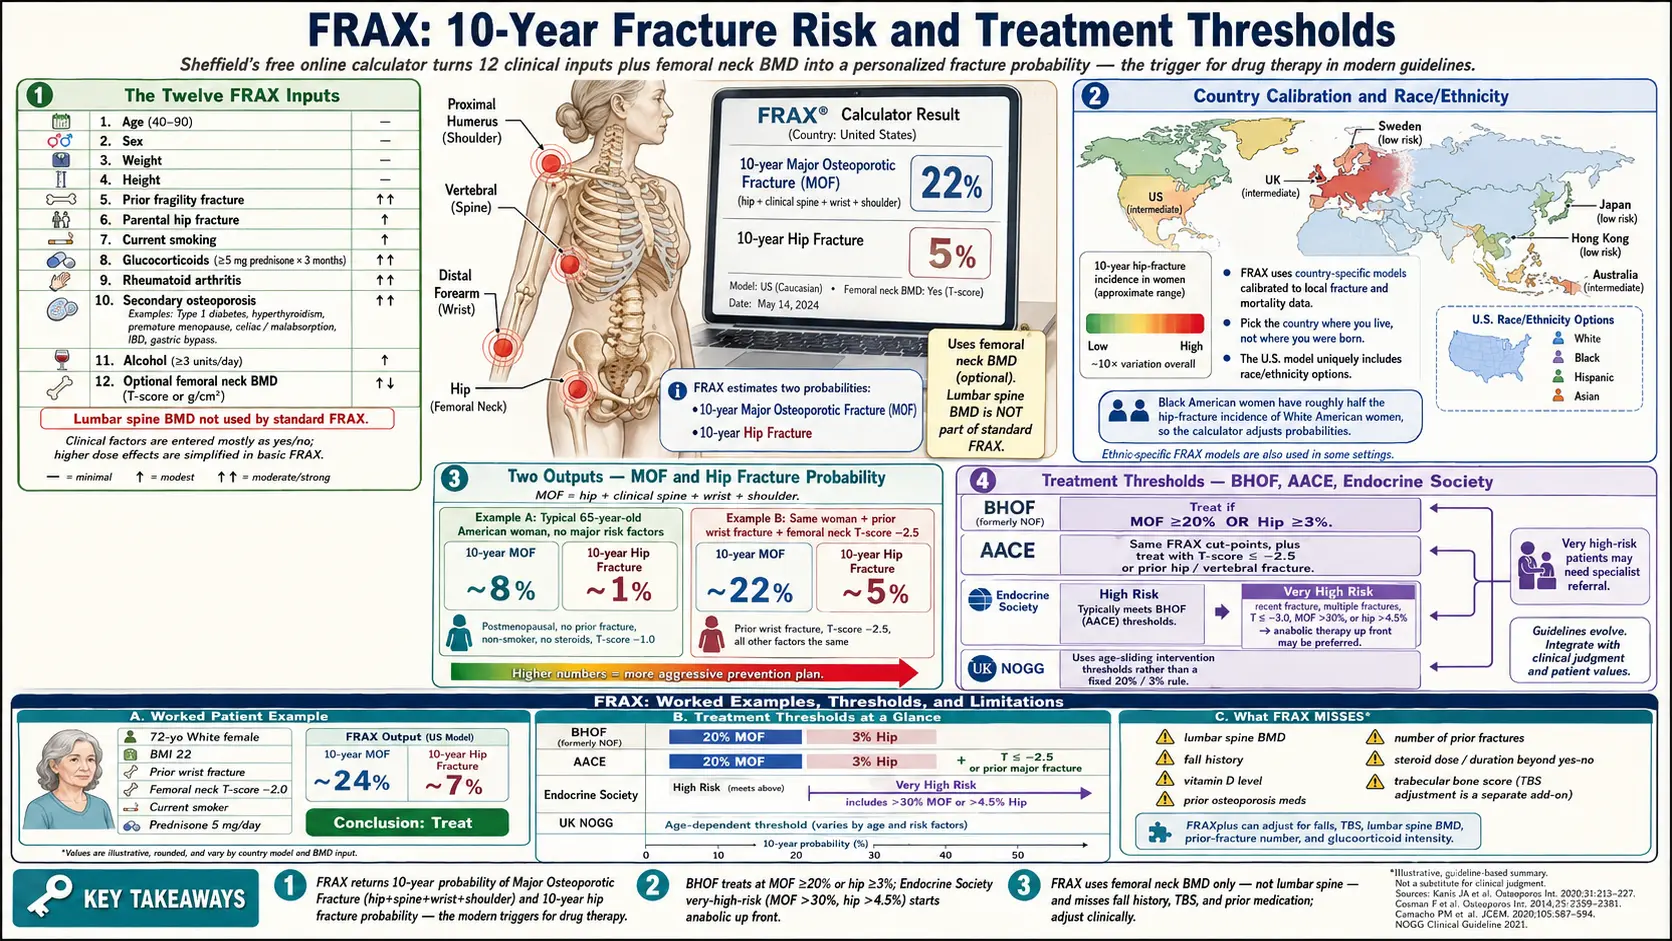
Table of Contents
- What FRAX Is and Why It Exists
- The Twelve FRAX Inputs — What Each One Means
- Reading the Output: MOF and Hip Fracture Risk
- Country and Race/Ethnicity Calibration
- Treatment Thresholds: BHOF, AACE, Endocrine Society
- TBS Adjustment and Other Modifiers
- Garvan and QFracture: The Alternatives
- Where FRAX Falls Short
- FRAX-Guided Decisions: Drugs vs. Lifestyle
- A Walk-Through: Calculating Your Own FRAX
- Questions to Ask Your Clinician
- Key Research Papers
- Connections
- Featured Videos
What FRAX Is and Why It Exists
FRAX — short for Fracture Risk Assessment Tool — is a free online calculator developed by the University of Sheffield in 2008 under the leadership of Professor John Kanis and the World Health Organization Collaborating Centre for Metabolic Bone Diseases. Its job is to answer one question: "What is the probability that this person will break a bone in the next ten years?"
Before FRAX, clinicians made treatment decisions almost entirely on bone density numbers — the T-score from a DEXA scan. Anyone with a T-score at or below −2.5 got labeled osteoporotic and was offered drug therapy; anyone above it was sent home. The problem is that the majority of fragility fractures actually occur in people whose T-score is not in the osteoporotic range. A 72-year-old woman with a T-score of −2.0 who already broke her wrist in a fall last year is at higher ten-year risk than a 55-year-old with a T-score of −2.6 and no other risk factors — yet the older rule would treat the second and ignore the first.
FRAX fixed that by folding bone density into a much larger picture. It pools bone mineral density with age, prior fractures, family history, smoking, steroid use, and other clinical inputs, then produces two percentages: your probability of a major osteoporotic fracture (hip, spine, wrist, or shoulder) and your probability of a hip fracture over the next decade. Those two numbers are what modern guidelines use to trigger drug therapy — not the T-score alone.
The calculator is available free at frax.shef.ac.uk (or, since 2024, at the mirror frax.shef.ac.uk/FRAX4/). Dozens of national models are selectable from a dropdown. It runs in any browser, takes about two minutes, and is used by primary care physicians, endocrinologists, rheumatologists, and patients themselves.
The Twelve FRAX Inputs — What Each One Means
FRAX asks for twelve pieces of information. Eleven are clinical; the twelfth is optional bone density. Each input was chosen because the Sheffield team pooled data from nine international population cohorts (roughly 60,000 participants, 250,000 person-years) and identified these twelve as the strongest independent predictors of fracture.
- Age. Accepted range 40 to 90 years. Fracture risk rises almost exponentially across this span — doubling roughly every seven to eight years after age 50.
- Sex. Female or male. Women have higher absolute fracture risk at every age because of lower peak bone mass and accelerated loss at menopause, but men catch up in the eighties and have higher mortality after hip fracture.
- Weight (kg) and height (cm). Used together to compute BMI. Low BMI is a strong independent risk factor; high BMI is mildly protective up to a point (obesity beyond a BMI of about 35 starts to lose its protective effect and may increase humerus and ankle fractures).
- Previous fracture. Yes/no. Refers to any adult fracture occurring spontaneously or from trauma that would not break a healthy bone. A prior fragility fracture roughly doubles the risk of the next one.
- Parental hip fracture. Yes/no. Either biological parent having broken a hip. Captures genetic bone-quality and geometry factors that FRAX cannot measure directly.
- Current smoking. Yes/no. Smoking accelerates bone loss, impairs calcium absorption, and lowers estrogen; ex-smokers who quit years ago are closer to never-smokers.
- Glucocorticoids. Yes/no for current or past exposure to oral steroids at 5 mg of prednisone or more daily for three months or longer. Higher or longer courses (notably ≥7.5 mg/day) carry greater risk than the FRAX checkbox captures — see the TBS/modifier section below.
- Rheumatoid arthritis. Yes/no. Confirmed RA is a specific risk factor beyond its steroid treatment. Osteoarthritis does not count.
- Secondary osteoporosis. Yes/no. Checks a grab-bag of conditions strongly linked to bone loss: type 1 diabetes, untreated hyperthyroidism, premature menopause (before age 45), chronic malnutrition or malabsorption (celiac disease, inflammatory bowel disease, gastric bypass), and chronic liver disease. See the secondary osteoporosis article for the full list.
- Alcohol. Yes/no for three or more units per day (a unit is roughly 8–10 g of ethanol — half a pint of beer, a small glass of wine, or one shot of spirits). Heavy alcohol directly suppresses osteoblasts and raises fall risk.
- Femoral neck BMD (optional). Entered as a T-score or raw g/cm² value from a DEXA scan. FRAX uses femoral neck BMD specifically — not total hip, not lumbar spine. You can run FRAX without BMD; the output is still usable but less precise.
What FRAX does not ask about is almost as important as what it asks. It does not take lumbar-spine BMD, trabecular bone score, fall history, vitamin D level, previous osteoporosis medications, number of prior fractures, dose or duration of steroids beyond the checkbox, or frailty measures. Those gaps drive most of the tool's known limitations.
Reading the Output: MOF and Hip Fracture Risk
After you click "Calculate," FRAX returns two numbers:
- 10-year probability of a major osteoporotic fracture (MOF). The chance you will break your hip, spine (clinically diagnosed vertebral fracture), wrist, or proximal humerus (shoulder) over the next decade. This is the headline number.
- 10-year probability of hip fracture. A subset of MOF, reported separately because hip fractures carry by far the highest mortality and disability. Roughly one in four people over 65 who break a hip dies within a year; of survivors, half never regain pre-fracture mobility.
The numbers are percentages. A MOF of 18% means that out of 100 people with your exact risk profile, about 18 will experience a major osteoporotic fracture in the next ten years. That is a population average, not a personal certainty — you will either fracture or you will not — but it calibrates how aggressive your prevention plan should be.
A typical 65-year-old American woman with no risk factors and an unremarkable DEXA will return a MOF around 8–10% and a hip risk around 1%. The same woman with a prior wrist fracture and a T-score of −2.5 might land near 22% MOF and 5% hip — well into the "treat now" zone.
Country and Race/Ethnicity Calibration
Fracture incidence varies roughly tenfold between countries, and FRAX is built around that. At the top of the calculator you select a country-specific model. The U.S. model was built on the Study of Osteoporotic Fractures and Framingham data; the U.K. model on the General Practice Research Database; Japan, Sweden, Hong Kong, and dozens of others on their own national datasets. Picking the wrong country can shift your result by a factor of two or more.
The U.S. model is unusual in that it asks a second question: race/ethnicity, with four options — White, Black, Hispanic, or Asian. This is because U.S. hip fracture rates differ substantially across these groups. Black American women, for example, have roughly half the age-adjusted hip fracture incidence of White American women, and FRAX reflects that. Pick the ancestry that best matches your background; mixed ancestry defaults to the higher-risk option (White) in most clinical practice.
If you are an immigrant who has lived in the U.S. for decades, most rheumatologists use the U.S. model. If you were tested abroad during a short trip, use the model of the country where you live. When in doubt, run both and compare.
Treatment Thresholds: BHOF, AACE, Endocrine Society
FRAX returns percentages; turning percentages into a decision requires a threshold. The U.S. has a single dominant threshold, but international and specialty guidelines vary.
- Bone Health and Osteoporosis Foundation (BHOF) — formerly the National Osteoporosis Foundation (NOF), renamed in 2021. Recommends drug therapy for any postmenopausal woman or man aged 50+ with MOF ≥ 20% or hip fracture probability ≥ 3%. These thresholds were set by the NOF in 2008 using a cost-effectiveness analysis pegged to the price of generic alendronate at the time. They remain the single most widely cited U.S. cut-points.
- American Association of Clinical Endocrinologists (AACE) and the American College of Endocrinology. Uses the same 20% MOF and 3% hip cut-points for patients with low bone mass (T-score between −1.0 and −2.5), but also recommends treatment for anyone with T-score ≤ −2.5 or a prior hip or vertebral fragility fracture regardless of FRAX output.
- Endocrine Society (postmenopausal women, 2019 and 2020 update). Splits patients into "high" and "very high" fracture risk. "Very high" (very recent fracture, multiple fractures, fracture on osteoporosis drug therapy, T-score ≤ −3.0, FRAX MOF > 30% or hip > 4.5%) gets an anabolic agent (teriparatide, abaloparatide, or romosozumab) up front rather than a bisphosphonate. See the anabolic drug article for details.
- United Kingdom (NOGG). Uses a sliding, age-dependent threshold instead of a fixed 20%/3% rule. A 55-year-old with MOF 12% falls above the treatment line; a 75-year-old with MOF 22% falls below it, because background risk is much higher at 75. The line on the NOGG chart is derived from the risk of someone the same age who has already had a prior fracture.
If you are an American over 50 and your FRAX MOF is 20% or more, or your hip probability is 3% or more, U.S. guidelines say you qualify for pharmacotherapy. Below those lines, the decision is nuanced and personal — discussed in the decision section below.
TBS Adjustment and Other Modifiers
FRAX is a blunt instrument, and clinicians now layer refinements on top of it.
Trabecular Bone Score (TBS) is a texture index derived from the same DEXA image used for BMD. It estimates how well the microstructure inside your vertebrae is holding up — a richer, more interconnected trabecular network scores higher. TBS adds information FRAX misses because it comes from the lumbar spine rather than the femoral neck. A low TBS (< 1.200) can push a borderline FRAX above the treatment threshold; a high TBS (> 1.350) can pull it below. Many modern DEXA machines calculate TBS automatically, and the FRAX website offers a built-in TBS adjustment field.
Glucocorticoid dose adjustment. FRAX treats all steroid exposure as a single yes/no. In reality, risk scales with dose. The Leib/Kanis correction multiplies FRAX output by roughly 1.15 for MOF and 1.20 for hip if daily prednisone is 7.5 mg or higher, or leaves it unchanged for 2.5–7.5 mg, or reduces it by about 0.80 if the patient is on less than 2.5 mg. Your rheumatologist should apply this mentally.
Recency of prior fracture. The highest re-fracture risk occurs in the first two years after a fragility fracture. FRAX treats all prior fractures equally, so it undercounts recent ones. A hip or vertebral fracture within the past 12–24 months should push you toward "very high risk" regardless of the raw percentage.
Multiple fractures. FRAX counts "previous fracture" as yes/no, so someone with three prior vertebral fractures has the same input as someone with one wrist fracture. In truth the first person is at dramatically higher risk. Guidelines work around this by calling any person with two or more fragility fractures "very high risk" and offering anabolic therapy.
Fall risk and frailty. FRAX ignores both. A frail 82-year-old who falls twice a year has higher fracture risk than a robust 82-year-old with the same BMD, but FRAX returns the same number. See fracture prevention and fall risk for assessments that cover this gap.
Garvan and QFracture: The Alternatives
FRAX is not the only fracture calculator, and its competitors address some of its gaps.
Garvan Fracture Risk Calculator — developed at the Garvan Institute in Sydney using the Dubbo Osteoporosis Epidemiology Study. Free at garvan.org.au/bone-fracture-risk. Key differences from FRAX: Garvan includes number of previous fractures (not just yes/no) and number of falls in the past year (one, two, three, or more), both of which FRAX ignores. It returns a 5-year and 10-year risk rather than FRAX's single 10-year number. It does not ask about parental fracture, smoking, steroids, RA, or secondary osteoporosis. In head-to-head studies, Garvan performs similarly to FRAX overall but better in older, frailer patients with multiple falls.
QFracture — developed in the U.K. using the QResearch primary-care database (roughly 3 million people). Free at qfracture.org. Accepts the widest input set of any calculator: 30+ variables including diabetes type 1 and 2, cardiovascular disease, dementia, Parkinson's, epilepsy, asthma, chronic liver or kidney disease, and current medications (antidepressants, estrogens, antidementia drugs). It does not use BMD at all. It is U.K.-calibrated and not validated for most other countries.
In U.S. practice FRAX dominates because it is embedded in DEXA machine software (Hologic and GE-Lunar print FRAX scores on every report) and is the one calculator mentioned by CMS, Medicare Advantage quality metrics, and every major U.S. guideline. Garvan or QFracture make sense as second opinions when FRAX and clinical judgment disagree.
Where FRAX Falls Short
Understanding FRAX's blind spots matters because a 19% MOF result can look reassuring on paper while missing a very real risk. The most important limitations:
- No lumbar spine BMD input. FRAX uses femoral neck BMD only. Yet many people — particularly those with glucocorticoid exposure, early menopause, or certain genetic conditions — lose bone at the lumbar spine first. If your lumbar T-score is much worse than your femoral neck T-score, FRAX underestimates your risk. The TBS adjustment partially compensates.
- No treatment history. FRAX assumes you are drug-naive. If you are already on a bisphosphonate, denosumab, teriparatide, or HRT, the output does not reflect that. A person five years into alendronate therapy may still have a FRAX above threshold even though treatment has already cut real-world risk by 40–50%.
- Binary risk factors. Prior fracture, steroid use, and alcohol are all yes/no, losing important gradation.
- Silent vertebral fractures invisible. Roughly two-thirds of vertebral fractures are painless and never enter the medical record, so the "prior fracture" box goes unchecked. A lateral vertebral fracture assessment (VFA) on DEXA, or a thoracolumbar X-ray if you have lost more than 1.5 inches of height, catches these.
- Fall risk ignored. Discussed above.
- Age capped at 90. A 95-year-old is entered as 90. Very high-age risk is therefore underestimated, though at that age most decisions rest on function and goals of care rather than percentage points.
- Race/ethnicity categories are coarse. The U.S. four-category system flattens substantial within-group variation. South Asian, Southeast Asian, and East Asian groups all share the "Asian" button despite different underlying fracture rates.
FRAX-Guided Decisions: Drugs vs. Lifestyle
Translating the FRAX output into action follows a rough tier system.
MOF below 10% and hip below 1%. Low risk. Focus entirely on lifestyle: calcium and vitamin D intake, protein, resistance training, weight-bearing exercise, smoking cessation, moderate alcohol, fall-proofing the home. No drug therapy. Retest DEXA in 3–5 years unless something changes. See the nutrition article and the exercise article.
MOF 10–19% or hip 1–2.9%. Moderate risk — the gray zone. The raw numbers alone do not trigger U.S. pharmacotherapy, but modifiers may: recent fragility fracture, low TBS, high steroid dose, multiple falls, rapid bone loss between serial DEXAs. Have a real conversation with your clinician. Many patients in this zone opt for lifestyle plus oral bisphosphonate; others decline drugs until risk climbs further.
MOF 20% or above, or hip 3% or above. BHOF threshold met. U.S. guidelines recommend pharmacotherapy. First-line is usually an oral bisphosphonate (alendronate or risedronate) or IV zoledronate; details in the bisphosphonates article. Denosumab is an alternative for patients who cannot tolerate oral bisphosphonates or have kidney disease.
"Very high risk." MOF above 30%, hip above 4.5%, T-score below −3.0, multiple fractures, or a hip or vertebral fracture within the last two years. Endocrine Society and AACE recommend starting with an anabolic (bone-building) agent — teriparatide, abaloparatide, or romosozumab — for 12–24 months, then transitioning to an antiresorptive. See the anabolic drug article.
Regardless of tier, lifestyle is not optional. Drugs on top of a poor diet, sedentary life, and an unsafe home give you a fraction of the benefit they could.
A Walk-Through: Calculating Your Own FRAX
Run it yourself. It is free and takes two minutes.
- Go to frax.shef.ac.uk. Under "Calculation Tool," pick your country. U.S. residents pick "US" and then one of White, Black, Hispanic, or Asian.
- Enter age (or date of birth), sex, weight in kg, height in cm. Metric converter buttons are provided — 5'4" is 163 cm, 150 lb is 68 kg.
- Click yes/no for previous fracture, parental hip fracture, current smoking, glucocorticoids (past or present 5+ mg prednisone for 3+ months), rheumatoid arthritis, secondary osteoporosis, alcohol (3+ units/day).
- If you have a recent DEXA, enter femoral neck BMD. Choose "T-score" and type the number (e.g., −2.3). If you do not have a DEXA, leave it blank — the output will still be meaningful.
- Click "Calculate." Write down both numbers: MOF and hip.
- Print or screenshot the page. Bring it to your next appointment. Your physician may already have run it from the DEXA report, but having your own number opens the conversation.
Questions to Ask Your Clinician
- What is my FRAX MOF and hip 10-year probability?
- Was it calculated with or without my DEXA bone density?
- Did we run TBS adjustment from my DEXA?
- Does my steroid dose or recent fracture put me in the "very high risk" category even if my raw FRAX is below the usual threshold?
- Based on my FRAX, do we start with lifestyle alone, an oral bisphosphonate, an infusion, or an anabolic agent?
- When should we repeat FRAX and DEXA to see if anything has changed?
Key Research Papers
The original Kanis FRAX derivation papers, validation and adjustment studies (Leslie BMD-input, Kanis glucocorticoid adjustment, McCloskey TBS adjustment), competing calculators (Garvan, QFracture), and the NOF/BHOF, AACE, Endocrine Society, and ACP guidelines that translate FRAX output into US treatment thresholds.
- Kanis JA, Johnell O, Odén A, Johansson H, McCloskey E. FRAX and the Assessment of Fracture Probability in Men and Women from the UK. Osteoporosis International. 2008;19(4):385–397.
- Kanis JA, Odén A, Johansson H, Borgström F, Ström O, McCloskey E. FRAX and Its Applications to Clinical Practice. Bone. 2009;44(5):734–743.
- Kanis JA, Johansson H, Odén A, McCloskey EV. Guidance for the Adjustment of FRAX According to the Dose of Glucocorticoids. Osteoporosis International. 2011;22(3):809–816.
- McCloskey EV, Odén A, Harvey NC, et al. A Meta-Analysis of Trabecular Bone Score in Fracture Risk Prediction and Its Relationship to FRAX. Journal of Bone and Mineral Research. 2016;31(5):940–948.
- Tosteson ANA, Melton LJ 3rd, Dawson-Hughes B, et al. Cost-Effective Osteoporosis Treatment Thresholds: The United States Perspective. Osteoporosis International. 2008;19(4):437–447.
- Nguyen ND, Frost SA, Center JR, Eisman JA, Nguyen TV. Development of Prognostic Nomograms for Individualizing 5-Year and 10-Year Fracture Risks (Garvan). Osteoporosis International. 2008;19(10):1431–1444.
- Hippisley-Cox J, Coupland C. Predicting Risk of Osteoporotic Fracture in Men and Women in England and Wales: Prospective Derivation and Validation of QFractureScores. BMJ. 2009;339:b4229.
- Leslie WD, Lix LM, Johansson H, Odén A, McCloskey E, Kanis JA. Independent Clinical Validation of a Canadian FRAX Tool: Fracture Prediction and Model Calibration. Journal of Bone and Mineral Research. 2010;25(11):2350–2358.
- Cosman F, de Beur SJ, LeBoff MS, et al. Clinician's Guide to Prevention and Treatment of Osteoporosis. Osteoporosis International. 2014;25(10):2359–2381.
- Camacho PM, Petak SM, Binkley N, et al. AACE/ACE Clinical Practice Guidelines for the Diagnosis and Treatment of Postmenopausal Osteoporosis — 2020 Update. Endocrine Practice. 2020;26(Suppl 1):1–46.
- Eastell R, Rosen CJ, Black DM, Cheung AM, Murad MH, Shoback D. Pharmacological Management of Osteoporosis in Postmenopausal Women: An Endocrine Society Clinical Practice Guideline. Journal of Clinical Endocrinology & Metabolism. 2019;104(5):1595–1622.
- Qaseem A, Hicks LA, Etxeandia-Ikobaltzeta I, et al. Pharmacologic Treatment of Primary Osteoporosis or Low Bone Mass to Prevent Fractures in Adults: A Living Clinical Guideline From the American College of Physicians. Annals of Internal Medicine. 2023;176(2):224–238.
Live PubMed Searches
Live PubMed queries that update as new papers are indexed.
- PubMed: FRAX risk assessment
- PubMed: FRAX treatment threshold
- PubMed: TBS FRAX adjustment
- PubMed: FRAX glucocorticoid adjustment
- PubMed: Garvan calculator
- PubMed: QFracture validation
- PubMed: FRAX US ethnicity
- PubMed: imminent fracture risk
Connections
- Bone Remodeling & Calcium Balance — interactive animation
- Osteoporosis
- Bisphosphonates
- Fracture Prevention and Fall Risk
- DEXA Scan: T-Score and Z-Score
- Weight-Bearing and Resistance Exercise
- Secondary Osteoporosis Causes
- Denosumab, Romosozumab and Teriparatide
- Calcium, Vitamin D and Protein Intake
- Postmenopausal Osteoporosis and Hormone Therapy
- Calcium
- Vitamin D3
- Arthritis
- Diabetes
- Celiac Disease
- Inflammatory Bowel Disease