DEXA Scan — T-Score and Z-Score Explained
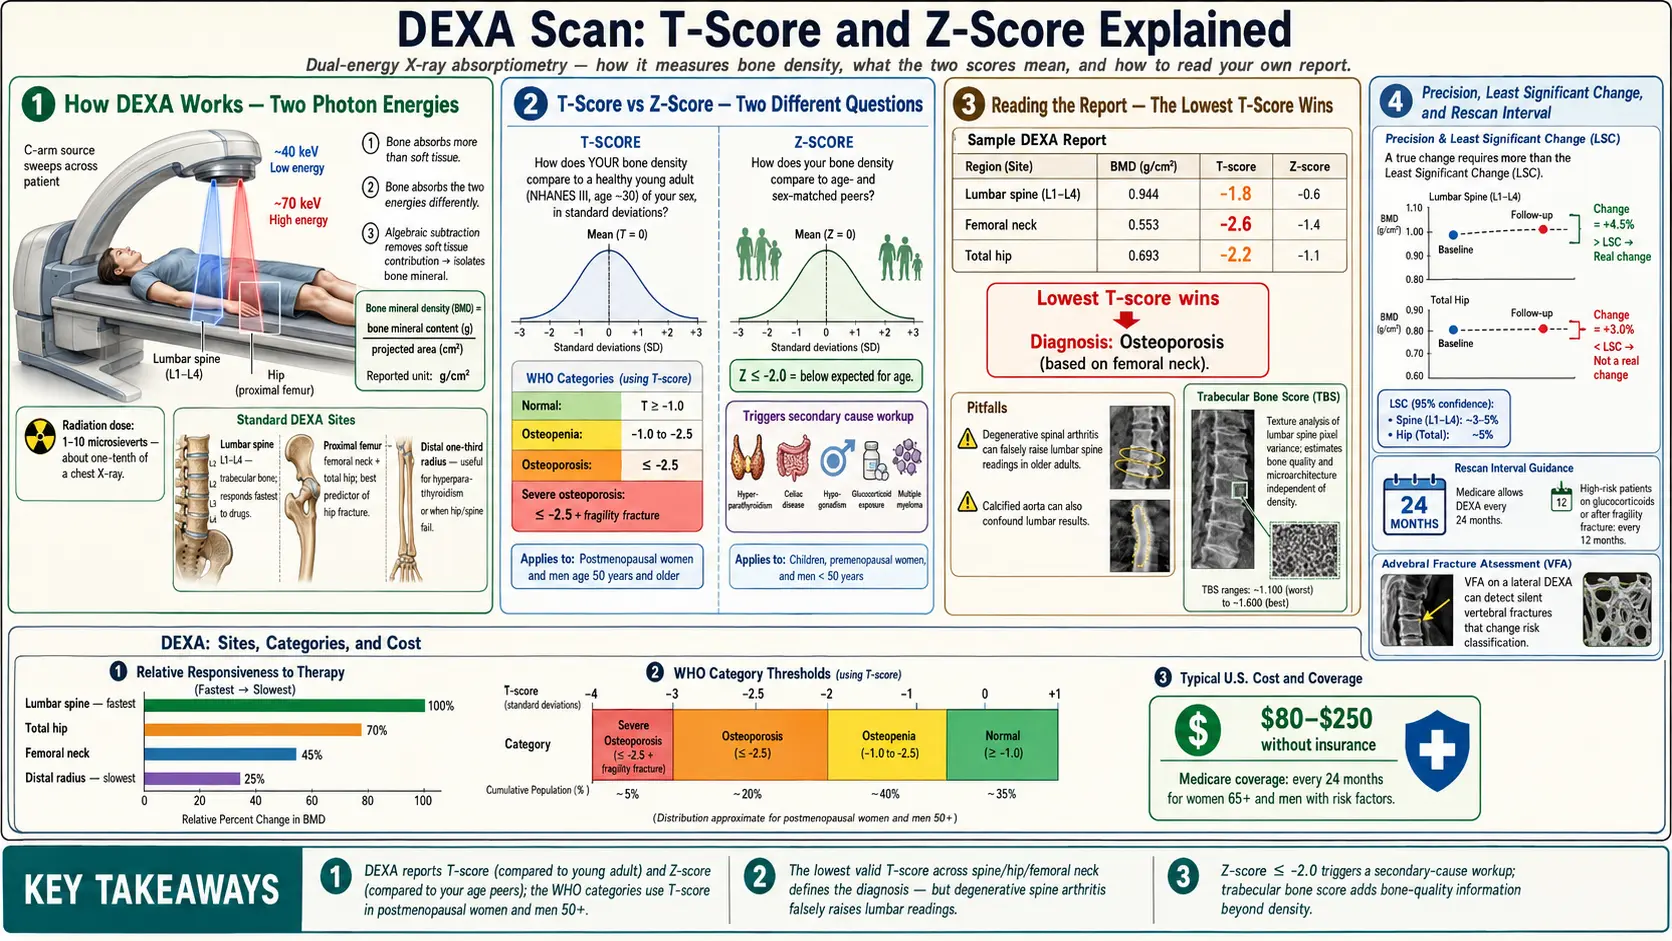
Table of Contents
- What a DEXA Scan Actually Is
- How the Technology Works
- Which Sites Get Scanned — and Why
- T-Score: Comparing You to a Young Adult
- Z-Score: Comparing You to Your Own Age Group
- The WHO Categories: Normal, Osteopenia, Osteoporosis
- Precision, Least Significant Change, and Repeat Scans
- How Often Should You Be Rescanned?
- Trabecular Bone Score (TBS) — Bone Quality, Not Just Quantity
- Vertebral Fracture Assessment (VFA)
- Pitfalls That Can Fool a DEXA
- HR-pQCT and Other Research Tools
- How to Read Your Own DEXA Report
- Key Research Papers
- Connections
- Featured Videos
What a DEXA Scan Actually Is
DEXA stands for dual-energy X-ray absorptiometry (sometimes written DXA). It is the single most common and most validated way to measure how dense your bones are. It is also the test that defines whether you have osteopenia, osteoporosis, or a perfectly normal skeleton — those words are not subjective descriptions, they are DEXA numbers written into international diagnostic criteria.
The scan itself is almost embarrassingly easy. You lie flat on a padded table, fully clothed (minus metal zippers, buttons, and jewelry). A C-arm slides slowly over your hip and low back, taking a few minutes in total. There is no injection, no contrast, no claustrophobia-inducing tube. The radiation dose is tiny — about 1–10 microsieverts depending on the machine and sites scanned, roughly one-tenth of a chest X-ray and about the same as a day of background radiation you would get from just being alive on Earth.
The scan costs in the United States typically run $80–$250 without insurance, and Medicare covers a baseline DEXA every 24 months for women 65+ and for younger women or men with specific risk factors (steroid use, fracture history, certain diseases). Many commercial insurers follow the same rule.
None of that is what makes the test tricky. What makes it tricky is interpreting the numbers — the T-score and Z-score that come out the other end, and the judgment calls about which score applies to you, which sites to trust, and what a change between two scans really means. That is what this article is for.
How the Technology Works
Every X-ray machine works by firing photons through tissue and measuring how many come out the other side. Dense tissue (bone) absorbs more photons; soft tissue (muscle, fat, organs) absorbs fewer. A normal X-ray uses one energy level, and the picture you get mixes bone and soft tissue into a single shadow — good for seeing a fracture, not good for measuring subtle changes in bone density.
DEXA solves that by using two different photon energies (typically around 40 keV and 70 keV). Bone and soft tissue absorb the two energies differently, and with a little algebra the scanner can mathematically subtract the soft tissue and leave only the bone signal. What it reports is bone mineral content (BMC, grams) divided by the projected area (cm²) of the region it scanned. That ratio is your bone mineral density (BMD), reported in grams per square centimeter.
Notice the word projected. DEXA is a two-dimensional measurement of a three-dimensional object. A big, tall vertebra will look denser than a small one even if the actual volumetric density is identical, simply because more bone ends up stacked in the X-ray path. This is one reason DEXA is not perfect, and one reason pediatric and small-stature adult readings need interpretation by someone who understands the limits.
Which Sites Get Scanned — and Why
A standard adult DEXA measures three regions, usually in this order:
- Lumbar spine (L1–L4). Measured from the front (antero-posterior). Rich in trabecular bone, the metabolically active "sponge" inside vertebral bodies. This is the site that responds fastest to bone-active drugs like bisphosphonates or teriparatide, and it is also the site most vulnerable to postmenopausal bone loss. Weakness: degenerative arthritis, calcified aorta, and old compression fractures falsely raise the reading in older adults.
- Proximal femur. Both the femoral neck (the narrow stalk at the top of the thigh bone) and the total hip (a broader region that also includes the trochanter and shaft) are reported. Hip BMD is the single best predictor of future hip fracture — the fracture that matters most because it carries a 20–30% one-year mortality in older adults.
- Forearm (distal one-third radius). Used when the hip and spine cannot be measured accurately, or as a required third site in patients with hyperparathyroidism (where cortical bone at the forearm is preferentially lost) and in very obese patients who exceed the table weight limit at the hip and spine.
Official International Society for Clinical Densitometry (ISCD) policy is to use the lowest T-score of the three valid regions (lumbar spine, femoral neck, total hip) for diagnosis. If one region is uninterpretable because of hardware, deformity, or artifact, it is dropped and the remaining regions are used. Your radiologist will not average all three; the weakest link defines the diagnosis.
T-Score: Comparing You to a Young Adult
The T-score answers one question: "How does your bone density compare to the average bone density of a healthy 30-year-old of your sex?" It is expressed in standard deviations above or below that young-adult reference mean.
- T-score of 0 means you have exactly the average density of a healthy 30-year-old.
- T-score of -1.0 means you are one standard deviation below that average.
- T-score of -2.5 means you are two-and-a-half standard deviations below — the WHO threshold for osteoporosis.
- A positive T-score (+0.5, +1.2) means your bones are denser than a young adult's — not unusual in larger-framed adults or regular resistance trainers.
The reference database built into every DEXA machine comes from the NHANES III dataset (Caucasian young adults), regardless of the patient's ethnicity — a standardization choice that keeps diagnostic thresholds comparable across the world. Some machines let technologists switch to ethnicity-matched references, which changes the T-score but not the underlying bone measurement. If you change labs or machines between scans, ask explicitly that the same reference database be used to avoid spurious drift.
The T-score is the score that defines the diagnosis in two groups:
- Postmenopausal women.
- Men aged 50 and older.
In those two groups, the WHO categories (normal, osteopenia, osteoporosis — see below) apply to the T-score and drive treatment decisions. In everyone else, the T-score is reported but is not the primary diagnostic number.
Z-Score: Comparing You to Your Own Age Group
The Z-score asks a different question: "How does your bone density compare to other people of your same age, sex, and (on some machines) ethnicity?" It is also expressed in standard deviations.
A Z-score of 0 means you match the average for your age. A Z-score of -2.0 or lower is considered "below the expected range for age" and is a red flag that something beyond normal aging is driving the bone loss — a secondary cause such as hyperparathyroidism, celiac disease, hypogonadism, chronic steroid use, myeloma, or an eating disorder. In that case, a careful secondary-cause workup is mandatory before assuming "age-related bone loss."
The Z-score is the primary score for:
- Premenopausal women.
- Men under age 50.
- Children and adolescents.
In those groups, T-scores are not used to diagnose osteoporosis, because the young-adult reference is either not meaningful (children are still building peak bone mass) or would inappropriately pathologize normal variation. A premenopausal woman with a T-score of -2.3 but a Z-score of -0.2 is a normal young person with naturally small bones, not a patient with osteoporosis.
The WHO Categories: Normal, Osteopenia, Osteoporosis
The World Health Organization adopted T-score thresholds in 1994 and they have barely changed since. For postmenopausal women and men 50+:
- Normal: T-score −1.0 or higher (i.e., -0.9, 0, +0.5, etc.)
- Osteopenia (low bone mass): T-score between -1.0 and -2.5.
- Osteoporosis: T-score -2.5 or lower.
- Severe (established) osteoporosis: T-score -2.5 or lower plus one or more fragility fractures (a fracture from a fall of standing height or less).
Two critical nuances that trip people up:
First, "osteopenia" is not a disease. It is a statistical category that includes a huge range of fracture risk — from someone whose bones are essentially fine but slightly below the young-adult average, to someone teetering on the edge of osteoporosis. A T-score of -1.1 and a T-score of -2.4 are both "osteopenia" but represent very different clinical situations. This is why modern practice combines DEXA with the FRAX 10-year fracture probability calculator rather than treating every osteopenia patient identically.
Second, a fragility fracture at the hip or spine diagnoses osteoporosis regardless of T-score. A postmenopausal woman who breaks a hip falling from standing height has osteoporosis even if her DEXA reads -1.8. The skeleton has already announced the diagnosis; the number is secondary.
Precision, Least Significant Change, and Repeat Scans
This is the single most misunderstood part of DEXA, and it is where many patients are told their "bones are getting worse" when the scanner is just noisy.
Every DEXA machine has a precision error — the normal scatter you get if you scanned the same person twice in one day with repositioning. A well-run facility quantifies this by scanning thirty volunteers twice each and computing the root-mean-square standard deviation. Typical numbers at the lumbar spine are 1.0–1.5%, at the total hip 1.0–1.8%, and at the femoral neck 1.5–2.5%.
To decide whether a real change occurred between two scans, you need the least significant change (LSC), which is 2.77 × the precision error (a statistical calculation that yields 95% confidence). In practice, that means:
- At the spine, a real change usually requires at least 3% BMD change.
- At the total hip, roughly 4–5%.
- At the femoral neck, often 5–6% — which is why many clinicians ignore femoral-neck changes on short-interval repeat scans.
A 2% "drop" in BMD over two years is almost always noise, not bone loss. A legitimate facility prints the LSC on every report; if yours does not, ask for it. And for serial monitoring, get scanned on the same machine whenever possible, because LSCs do not carry across manufacturers (Hologic, GE-Lunar, Norland) or even across individual units.
How Often Should You Be Rescanned?
Rescanning too frequently is a common problem. DEXA bone density changes slowly, and repeat scans earlier than the LSC allows can only mislead, not inform. Current guidance:
- Baseline normal T-score (-1.0 or higher), no risk factors: repeat in 10–15 years or when risk factors change.
- Mild osteopenia (T-score -1.0 to -1.5): repeat in 5 years.
- Moderate osteopenia (-1.5 to -2.0): repeat in 3–5 years.
- Advanced osteopenia (-2.0 to -2.5) or osteoporosis: baseline at treatment start, then every 1–2 years until stable, then every 2–3 years.
- Starting steroids or an aromatase inhibitor: baseline and annual repeats for the first few years.
- On a bisphosphonate holiday: repeat DEXA every 1–2 years to catch a restart threshold.
Medicare's default "every two years" is a reimbursement rule, not a clinical rule. Many patients do not need scans that often, and some unstable patients need them more.
Trabecular Bone Score (TBS) — Bone Quality, Not Just Quantity
Two people can have the same lumbar-spine BMD and very different fracture risks, because BMD measures how much mineral is there but not how well it is organized. The trabecular bone score addresses this gap. TBS is a grayscale texture analysis of the same lumbar-spine DEXA image — a software add-on that measures the fine-grained variability of pixel intensities, which correlates with the three-dimensional microarchitecture of the trabecular network.
A high TBS (above 1.31) indicates a dense, well-organized trabecular network. A low TBS (below 1.23) indicates a thinned, perforated network that predicts fracture independently of BMD. Between 1.23 and 1.31 is intermediate.
TBS is particularly useful in:
- Type 2 diabetes, where BMD is often normal or high but fracture risk is elevated — TBS catches the hidden risk.
- Glucocorticoid-treated patients, where steroids degrade bone quality before they degrade quantity.
- Primary hyperparathyroidism and chronic kidney disease.
- Refining FRAX risk estimates (the calculator now accepts TBS as an optional input).
Not every DEXA facility offers TBS. If your BMD is borderline or you have diabetes, ask whether the facility has TBS licensed on its software.
Vertebral Fracture Assessment (VFA)
Up to two-thirds of vertebral compression fractures are silent — no acute pain, no memorable event, just a gradual height loss and stooped posture. Yet a single vertebral fracture, even a painless one, roughly doubles the risk of future fractures and warrants osteoporosis treatment regardless of T-score.
VFA is a lateral-spine image captured during the same DEXA appointment (some machines require a slightly different positioning and a few extra seconds of scanning). It uses a low-dose lateral X-ray — about 1/100th the radiation of a standard spine X-ray — to look for vertebral height loss consistent with compression fracture. It cannot distinguish an acute fracture from an old one, but it does not need to; for osteoporosis management, the presence of any vertebral fracture changes the treatment decision.
The ISCD recommends VFA in women 70+ and men 80+ with a T-score of -1.0 or lower, postmenopausal women and men 50+ with historical height loss over 4 cm, anyone with chronic glucocorticoid therapy, and anyone with a prior known vertebral fracture. If your DEXA facility does not mention VFA and you fit one of these categories, ask whether it is available.
Pitfalls That Can Fool a DEXA
A DEXA number is only as good as the image behind it, and several common situations quietly inflate or deflate the reading:
- Lumbar osteoarthritis. Bridging osteophytes, facet joint hypertrophy, and end-plate sclerosis pile extra mineral into the X-ray path. Spine T-scores in patients over 65 are frequently falsely elevated by 0.5–1.5 SD. When the report shows one vertebra much denser than its neighbors, a good radiologist will exclude it.
- Aortic calcification. An aged, calcified abdominal aorta sits directly in front of the lumbar spine on an AP scan. Its mineral content gets added to the spine BMD. Lateral-view DEXA avoids this problem but is not routine in the U.S.
- Prior vertebral compression fracture. A collapsed vertebra loses height but keeps its mineral content, so the projected 2D density (mineral per cm²) goes up. This is why a patient with known vertebral fractures should always have VFA and why the fractured vertebra should be excluded from the BMD calculation.
- Surgical hardware. Pedicle screws, cages, and spinal fusions typically make the lumbar spine uninterpretable. The hip and forearm become the only reliable sites.
- Scoliosis and severe degeneration. Both distort the projected area. A skilled technologist will adjust the regions of interest, but results at the spine may be unreliable regardless.
- Recent contrast, calcium supplements, or barium studies. Retained contrast in the gut or a recent barium meal can cross the X-ray path and inflate the spine reading. Avoid DEXA for at least 72 hours after any contrast study.
- Obesity and the weight limit. Most tables top out around 350–450 lb. In very heavy patients, thick soft tissue also adds scatter that biases the reading. The forearm becomes the default site.
- Hip rotation. Poor internal rotation of the leg during positioning can artifactually lower femoral-neck BMD by 5% or more. A competent technologist uses a foot positioner to standardize.
- Machine change between scans. Different manufacturers use different calibration phantoms. A 3% "drop" between a GE-Lunar and a Hologic scan may be pure machine drift. Always try to use the same facility and the same machine for serial monitoring.
HR-pQCT and Other Research Tools
High-resolution peripheral quantitative computed tomography (HR-pQCT) is the research-grade successor to DEXA. Instead of a two-dimensional projection, HR-pQCT takes a true 3D CT scan of the distal radius or tibia at roughly 60–80 micrometer resolution — fine enough to visualize individual trabeculae and measure cortical thickness, cortical porosity, and 3D bone stiffness. Radiation dose is still modest (about 3–5 microsieverts per scan).
HR-pQCT is not a routine clinical test. Fewer than a hundred machines exist worldwide, concentrated at academic centers. But it has transformed research on type 2 diabetes bone disease, anorexia nervosa, chronic kidney disease mineral bone disorder, and the skeletal effects of romosozumab and teriparatide. If you enroll in an osteoporosis trial at a university medical center, you may encounter it.
Other imaging tools occasionally used include quantitative CT (QCT) of the spine or hip — true volumetric density in g/cm³, useful when DEXA is distorted by arthritis — and quantitative ultrasound of the heel, a screening tool used in pharmacies and health fairs that does not produce a T-score comparable to DEXA and does not establish a diagnosis.
How to Read Your Own DEXA Report
A typical DEXA report has a dense page of numbers and a one-paragraph interpretation. Here is what to look for, in order:
- Manufacturer and machine ID. Confirm this matches your prior scan if you are comparing.
- BMD values in g/cm² for each region (L1-L4, femoral neck, total hip, and forearm if done). The raw BMD is the number that actually carries forward between scans.
- T-score and Z-score for each region. Remember: T-score for postmenopausal women and men 50+; Z-score for everyone else.
- Which vertebrae were excluded and why (fracture, arthritis, hardware). A report that keeps all four vertebrae in an 80-year-old with obvious arthritis is under-read.
- LSC (least significant change). Usually at the bottom. Compare any reported change to this number before concluding you are losing bone.
- TBS, if available.
- VFA findings, if performed.
- FRAX 10-year probability, if the report includes it — many do now.
- The narrative summary with the diagnostic category and any recommendations.
If anything in the report confuses you, it is entirely reasonable to ask your primary care doctor or rheumatologist to walk you through it line by line. A fifteen-minute explanation is the difference between years of appropriate treatment and years of either needless anxiety or missed diagnosis.
Key Research Papers
The original WHO T-score definition, ISCD position-development conferences governing DXA technique and interpretation, the trabecular bone score (TBS) literature, USPSTF screening recommendations, and the major treatment guidelines that translate density numbers into prescriptions.
- Kanis JA, Melton LJ, Christiansen C, Johnston CC, Khaltaev N. The Diagnosis of Osteoporosis. Journal of Bone and Mineral Research. 1994;9(8):1137–1141.
- WHO Study Group. Assessment of Fracture Risk and Its Application to Screening for Postmenopausal Osteoporosis. World Health Organization Technical Report Series. 1994;843:1–129.
- Shuhart CR, Yeap SS, Anderson PA, et al. Executive Summary of the 2019 ISCD Position Development Conference on Monitoring Treatment, DXA Cross-calibration and Least Significant Change, Spinal Cord Injury, Peri-prosthetic and Orthopedic Bone Health, Transgender Medicine, and Pediatrics. Journal of Clinical Densitometry. 2019;22(4):453–471.
- Schousboe JT, Shepherd JA, Bilezikian JP, Baim S. Executive Summary of the 2013 International Society for Clinical Densitometry Position Development Conference on Bone Densitometry. Journal of Clinical Densitometry. 2013;16(4):455–466.
- Silva BC, Leslie WD, Resch H, et al. Trabecular Bone Score: A Noninvasive Analytical Method Based Upon the DXA Image. Journal of Bone and Mineral Research. 2014;29(3):518–530.
- McCloskey EV, Odén A, Harvey NC, et al. A Meta-Analysis of Trabecular Bone Score in Fracture Risk Prediction and Its Relationship to FRAX. Journal of Bone and Mineral Research. 2016;31(5):940–948.
- US Preventive Services Task Force; Curry SJ, Krist AH, Owens DK, et al. Screening for Osteoporosis to Prevent Fractures: USPSTF Recommendation Statement. JAMA. 2018;319(24):2521–2531.
- Camacho PM, Petak SM, Binkley N, et al. American Association of Clinical Endocrinologists / American College of Endocrinology Clinical Practice Guidelines for the Diagnosis and Treatment of Postmenopausal Osteoporosis — 2020 Update. Endocrine Practice. 2020;26(Suppl 1):1–46.
- Cosman F, de Beur SJ, LeBoff MS, et al. Clinician's Guide to Prevention and Treatment of Osteoporosis. Osteoporosis International. 2014;25(10):2359–2381.
- Cummings SR, Bates D, Black DM. Clinical Use of Bone Densitometry: Scientific Review. JAMA. 2002;288(15):1889–1897.
- Kanis JA, Bianchi G, Bilezikian JP, et al. Towards a Diagnostic and Therapeutic Consensus in Male Osteoporosis. Osteoporosis International. 2011;22(11):2789–2798.
- Engelke K, Adams JE, Armbrecht G, et al. Clinical Use of Quantitative Computed Tomography and Peripheral Quantitative Computed Tomography in the Management of Osteoporosis in Adults: The 2007 ISCD Official Positions. Journal of Clinical Densitometry. 2008;11(1):123–162.
Live PubMed Searches
Live PubMed queries that update as new papers are indexed.
- PubMed: DXA T-score and Z-score
- PubMed: DXA least significant change
- PubMed: trabecular bone score
- PubMed: vertebral fracture assessment
- PubMed: HR-pQCT microarchitecture
- PubMed: DXA lumbar artifact
- PubMed: ISCD positions
- PubMed: DXA monitoring interval
Connections
- Rheumatology
- Bone Remodeling & Calcium Balance — interactive animation
- Osteoporosis
- Secondary Osteoporosis Causes
- FRAX Risk Assessment
- Bisphosphonates
- Fracture Prevention and Fall Risk
- Postmenopausal Osteoporosis and Hormone Therapy
- Weight-Bearing and Resistance Exercise
- Denosumab, Romosozumab and Teriparatide
- Calcium, Vitamin D and Protein Intake
- Calcium
- Vitamin D3
- Arthritis
- Hyperparathyroidism
- Celiac Disease
- Bone Loss Prevention and HRT