Insulin Resistance
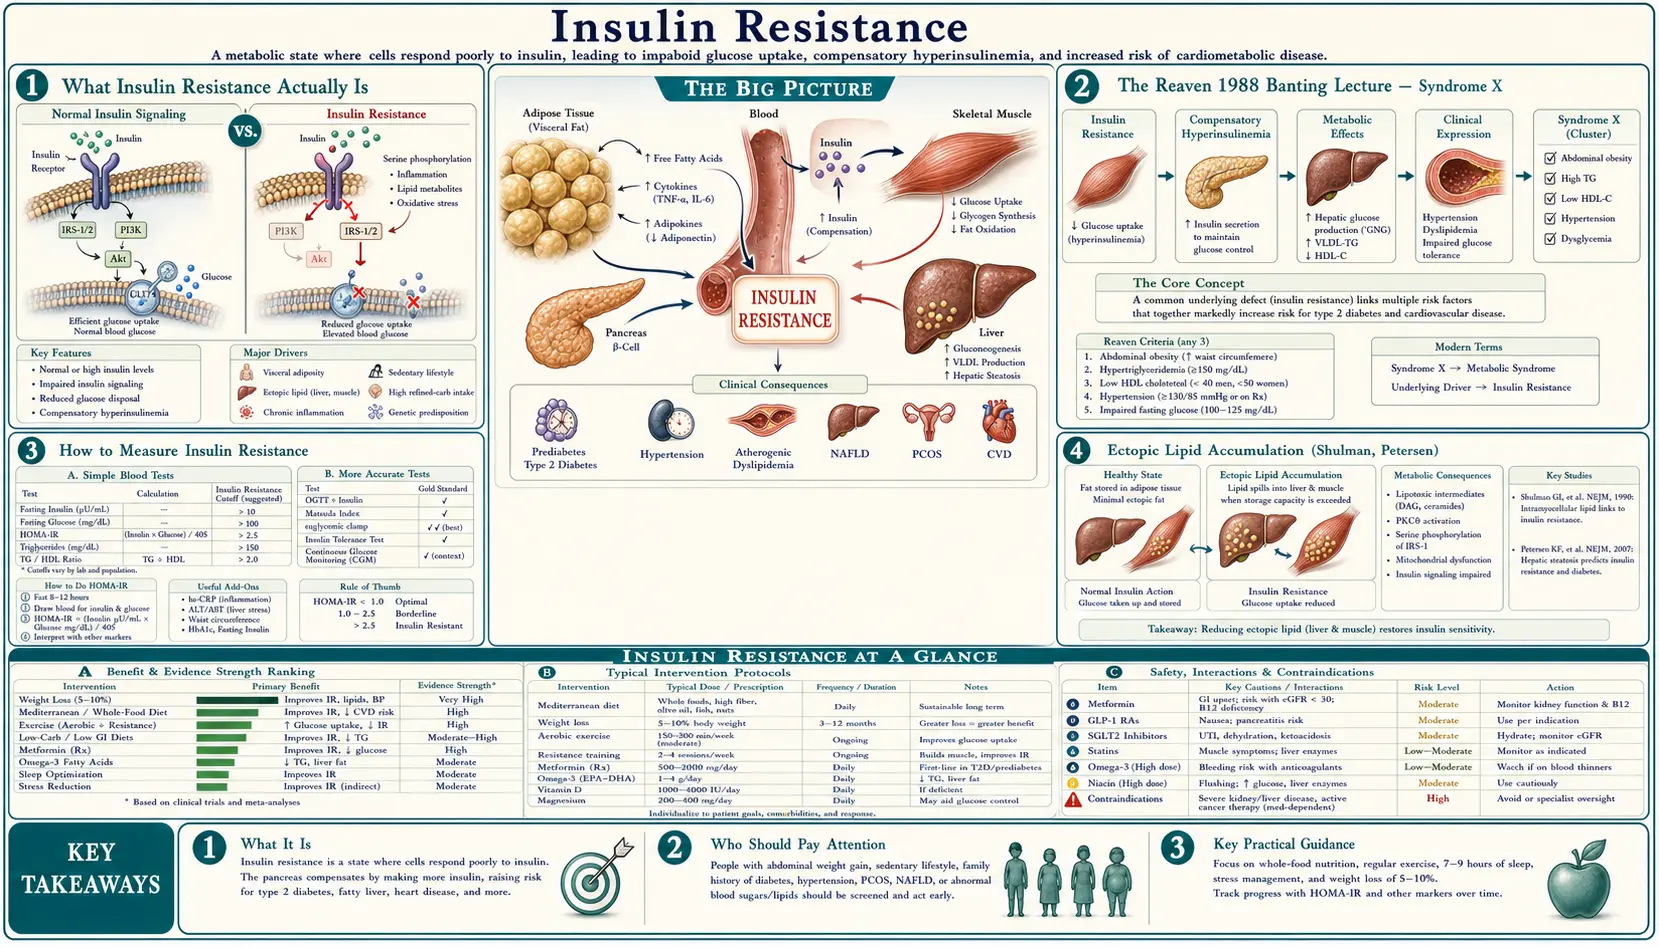
Insulin resistance is the single most important upstream cause of metabolic disease in the developed world. It is the underlying physiologic abnormality in Type 2 diabetes, fatty liver disease, polycystic ovary syndrome, gestational diabetes, and the constellation of cardiovascular risk Gerald Reaven named "Syndrome X" in his 1988 Banting Lecture. It precedes overt Type 2 diabetes by 10-20 years — meaning a person can have decades of escalating fasting insulin, advancing visceral and ectopic lipid accumulation, and progressing vascular damage while their fasting glucose and HbA1c remain in the normal range. Standard primary-care screening misses this because most clinicians do not order fasting insulin, the test that would reveal the upstream problem. This deep-dive covers the Reaven framework, the practical lab tests (HOMA-IR, fasting insulin), the Roger Unger / Gerald Shulman ectopic lipid model, the differential effect of fructose vs glucose on hepatic insulin signaling, the Roy Taylor "personal fat threshold" concept, and the reversibility window.
Table of Contents
- What Insulin Resistance Actually Is
- The Reaven 1988 Banting Lecture — Syndrome X
- How to Measure Insulin Resistance
- Ectopic Lipid Accumulation (Shulman, Petersen)
- Fructose, the Liver, and Hepatic Insulin Resistance
- The Taylor Personal Fat Threshold
- Downstream Conditions (NAFLD, PCOS, CVD, Cancer)
- The Reversibility Window (DiRECT, Virta, Counterpoint)
- Practical Reversal Protocols
- Key Research Papers
- Connections
- Featured Videos
What Insulin Resistance Actually Is
Insulin is the master regulator of glucose disposal. After a meal, pancreatic beta cells release insulin, which signals three tissues to dispose of the incoming glucose: skeletal muscle takes up glucose for storage as glycogen, the liver shuts down its own glucose production (hepatic gluconeogenesis suppression), and adipose tissue takes up glucose for storage as fat. The insulin receptor on each of these tissues triggers an intracellular signaling cascade (IRS-1 → PI3K → Akt → GLUT4 translocation in muscle and fat; FOXO1 inhibition in liver) that physically moves glucose transporters to the cell membrane and switches off glucose production.
Insulin resistance is the failure of this signaling cascade. The insulin molecule still binds to its receptor, but the downstream intracellular signaling is blunted. Each of the three target tissues requires more insulin than normal to achieve the same glucose-disposal effect. The pancreas compensates by secreting more insulin (hyperinsulinemia). Fasting and post-meal insulin levels rise, sometimes to 3-10× normal values, while fasting glucose initially stays in the normal range because the compensatory hyperinsulinemia is sufficient to maintain control.
This compensation can continue for years to decades. The transition to Type 2 diabetes occurs when the pancreatic beta cells fail to keep up with the rising insulin demand — either because of progressive beta-cell exhaustion, lipotoxicity from intra-pancreatic fat accumulation, or both. At that point, post-meal and then fasting glucose begin to rise, HbA1c crosses the diabetic threshold, and the diagnosis is finally made. The fundamental defect was present for 10-20 years before the standard diagnostic test caught it.
The Reaven 1988 Banting Lecture — Syndrome X
Gerald Reaven's 1988 American Diabetes Association Banting Lecture was the unification event for what became metabolic syndrome. Reaven, working at Stanford in the 1970s and 1980s with the euglycemic-hyperinsulinemic clamp technique developed by DeFronzo, observed that insulin resistance clustered consistently with five other findings: hyperinsulinemia, glucose intolerance, hypertriglyceridemia, low HDL cholesterol, and hypertension. He proposed that insulin resistance was the upstream cause of all five, and that the cluster — which he called "Syndrome X" — predicted cardiovascular disease independent of any single component.
The original Reaven Syndrome X criteria:
- Insulin resistance / hyperinsulinemia
- Glucose intolerance (impaired fasting glucose or impaired glucose tolerance)
- Hypertriglyceridemia (typically >150 mg/dL)
- Low HDL cholesterol (<40 mg/dL men, <50 mg/dL women)
- Hypertension (≥130/85 mmHg)
Later iterations (ATP III, IDF, AHA/NHLBI) added central adiposity (waist circumference >102 cm men, >88 cm women) as a sixth criterion, and the diagnostic threshold became 3 of 5. The IDF 2005 criteria made central adiposity mandatory, recognizing it as the strongest single predictor.
The Reaven framework reframed cardiovascular risk: it was not LDL cholesterol alone driving atherosclerosis, but a metabolic milieu of hyperinsulinemia + atherogenic lipid pattern (high TG, low HDL, small dense LDL) + hypertension, all driven by the upstream insulin resistance. The framework has been validated by 35 years of subsequent epidemiology and is now the dominant model for explaining the rising tide of cardiovascular and metabolic disease in the developed world.
How to Measure Insulin Resistance
The gold standard is the euglycemic-hyperinsulinemic clamp (DeFronzo, Tobin, Andres 1979). A controlled insulin infusion is given while glucose is infused at the rate needed to keep blood glucose constant. The glucose-infusion rate required equals the rate of glucose disposal, which is a direct measure of insulin sensitivity. The clamp is the research gold standard but takes 3-4 hours and is not done in clinical practice.
The clinically usable surrogates:
- HOMA-IR (Homeostatic Model Assessment of Insulin Resistance) — Matthews 1985. The simplest practical measure:
- HOMA-IR = (fasting insulin μIU/mL × fasting glucose mg/dL) / 405
- (Or in SI units: fasting insulin pmol/L × fasting glucose mmol/L / 22.5)
- Reference values:
- < 1.0 — optimal insulin sensitivity
- 1.0 – 1.9 — normal
- 2.0 – 2.9 — early insulin resistance
- ≥ 3.0 — significant insulin resistance
- Fasting insulin alone — even simpler. Fasting insulin > 10 μIU/mL is suggestive of insulin resistance in a non-diabetic; > 15 μIU/mL is clearly abnormal. The optimal range is roughly 2-5 μIU/mL.
- Fasting triglyceride-to-HDL ratio — a useful no-extra-test inference from the standard lipid panel. TG/HDL > 2.0 (US units, mg/dL) or > 0.87 (SI units, mmol/L) is a reasonable marker of insulin resistance in non-diabetics. The ratio is particularly useful in Caucasian populations; it is less reliable in African American populations because of different baseline lipid distributions.
- QUICKI (Quantitative Insulin Sensitivity Check Index) — another fasting-insulin-and-glucose-based formula, less commonly used than HOMA-IR.
- 2-hour insulin during oral glucose tolerance test — the Joseph Kraft 5-hour insulin assay (using 5 timepoints during a standard 75 g OGTT) is the most sensitive non-clamp test for early insulin resistance. Kraft Pattern III-V indicate insulin resistance even when glucose tolerance is normal.
The practical clinical insight: order a fasting insulin on any patient with central adiposity, hypertension, low HDL, elevated triglycerides, fatty liver, PCOS, gestational diabetes history, or family history of Type 2 diabetes. This single test, costing under $20, identifies the upstream metabolic defect 10-20 years before HbA1c becomes diagnostic. Most primary-care clinicians do not order it; ask for it by name.
Ectopic Lipid Accumulation (Shulman, Petersen)
Gerald Shulman and Kitt Petersen at Yale developed the most mechanistically detailed model of how insulin resistance physically arises in muscle and liver tissue. Their key insight: insulin resistance is driven not by the total amount of body fat but by where the fat is stored. Adipose tissue (subcutaneous fat) is the metabolically appropriate fat depot. When the storage capacity of subcutaneous adipose tissue is exceeded, fat spills over into ectopic locations — skeletal muscle (intramyocellular lipid, IMCL), liver (intrahepatic triglyceride, IHTG), and the pancreas itself (intra-pancreatic fat).
The mechanism in muscle:
- Excess fatty acid uptake into myocyte exceeds β-oxidation capacity.
- Accumulation of diacylglycerol (DAG) and ceramide as intermediates.
- DAG activates protein kinase C theta (PKCθ), which phosphorylates insulin receptor substrate 1 (IRS-1) on a serine residue, blocking the normal tyrosine phosphorylation by insulin.
- Blocked IRS-1 signaling means PI3K is not activated, Akt is not phosphorylated, GLUT4 is not translocated to the cell membrane, and glucose uptake is impaired.
The mechanism in liver is parallel but uses a different protein kinase C isoform (PKCε) and produces hepatic insulin resistance, manifesting as failure to suppress gluconeogenesis and continuing glucose output even in the fed state.
This model explains otherwise puzzling observations: some lean individuals have severe insulin resistance (the "thin outside, fat inside" phenotype with high liver fat despite normal BMI) and some obese individuals are metabolically healthy (the "metabolically healthy obese" phenotype with predominantly subcutaneous fat storage and low ectopic fat). BMI is a crude proxy; the actual determinant is liver and muscle lipid content.
Fructose, the Liver, and Hepatic Insulin Resistance
Fructose is metabolically distinct from glucose. Glucose can be metabolized by virtually every cell in the body via the glycolytic pathway. Fructose is metabolized almost exclusively in the liver (with small contributions from the small intestine and kidney), entering the metabolism via fructokinase (KHK), bypassing the rate-limiting phosphofructokinase step that controls glycolytic flux.
The unregulated entry of fructose into hepatic metabolism has three consequences:
- De novo lipogenesis — fructose carbons are preferentially converted to fatty acids, increasing hepatic triglyceride synthesis. This is the primary mechanism by which fructose drives nonalcoholic fatty liver disease.
- Hepatic insulin resistance — the accumulated hepatic DAG activates PKCε, blocking insulin signaling at the liver (the Shulman mechanism). The liver fails to suppress gluconeogenesis and continues glucose output despite high insulin.
- Uric acid production — the rapid fructokinase reaction depletes hepatic ATP, generating ADP and AMP, which is then degraded to uric acid. Elevated uric acid further impairs endothelial function and is itself associated with insulin resistance.
The Stanhope 2009 JCI trial randomized 32 overweight adults to consume 25% of calories as glucose-sweetened beverages or fructose-sweetened beverages for 10 weeks while maintaining isocaloric diets. Both groups gained similar weight, but the fructose group showed significant increases in visceral adiposity, hepatic de novo lipogenesis, fasting LDL and ApoB, postprandial triglycerides, and reduced whole-body insulin sensitivity. The glucose group showed none of these adverse effects. This is the cleanest demonstration that fructose and glucose are not metabolically equivalent.
The clinical implication: the form of carbohydrate matters. Sucrose (table sugar, 50% fructose), high-fructose corn syrup (55% fructose), agave nectar (90% fructose), and fruit juice all deliver concentrated fructose to the liver. Whole fruit is generally fine — the fiber matrix slows absorption and the total fructose dose per serving is modest. Fruit juice removes the fiber and delivers fructose at a rate that overwhelms hepatic processing.
The Taylor Personal Fat Threshold
Roy Taylor at Newcastle University developed the "personal fat threshold" (PFT) model to explain why some lean individuals develop Type 2 diabetes while some obese individuals do not. The PFT model proposes that each person has an individual threshold of fat accumulation above which their subcutaneous adipose tissue storage capacity is exceeded and ectopic lipid begins to accumulate in liver, muscle, and pancreas. This threshold varies dramatically between individuals.
Some people have a high PFT — they can accumulate substantial subcutaneous fat without exceeding their threshold, retain insulin sensitivity, and remain metabolically healthy even at high BMI. Other people have a low PFT — they exceed their threshold at modest BMI, develop ectopic lipid, and progress to insulin resistance and Type 2 diabetes despite remaining lean by conventional standards. Taylor's data suggest the PFT may be set by genetics and is approximately fixed for any individual.
The clinical implication is profound: Type 2 diabetes "reversal" in any individual requires loss of fat below their personal threshold, regardless of where that threshold sits on the BMI scale. Some patients with longstanding Type 2 diabetes can achieve full remission by losing only 10-15 kg, restoring liver and pancreatic fat content to below their individual threshold. Other patients require larger losses, and some — those whose beta cells have suffered irreversible damage during the prolonged hyperinsulinemic phase — cannot achieve remission regardless of weight loss.
The Taylor "twin cycle hypothesis" pulls all of this together: hepatic insulin resistance increases hepatic VLDL output → pancreatic lipid accumulation → beta cell lipotoxicity → impaired insulin secretion → hyperglycemia → further hepatic lipogenesis. Breaking this cycle requires sustained negative energy balance until both liver and pancreatic fat are reduced below the personal threshold.
Downstream Conditions (NAFLD, PCOS, CVD, Cancer)
Insulin resistance is the upstream defect in a large fraction of clinical conditions, often unrecognized:
- Type 2 diabetes — the obvious endpoint, but only after 10-20 years of compensated hyperinsulinemia. See our Endocrinology section.
- Nonalcoholic fatty liver disease (NAFLD) — now the most common chronic liver disease in the developed world, affecting 25-30% of adults. The liver fat accumulation is both consequence and driver of hepatic insulin resistance.
- Polycystic ovary syndrome (PCOS) — insulin resistance is the unifying mechanism. Hyperinsulinemia stimulates ovarian theca cell androgen production, suppresses sex hormone binding globulin, and amplifies LH-driven testosterone synthesis. Metformin is effective in PCOS precisely because it addresses the upstream insulin resistance.
- Gestational diabetes — pregnancy physiologically induces insulin resistance to ensure fetal glucose supply. Women with pre-existing borderline insulin resistance cross the gestational diabetes threshold; the diagnosis identifies the underlying chronic insulin resistance that will recur as Type 2 diabetes in 50% of affected women within 10 years.
- Cardiovascular disease — the Reaven Syndrome X cluster (high TG, low HDL, small dense LDL, hypertension) is fundamentally driven by hepatic insulin resistance. The atherogenic lipoprotein profile (high apoB, high TG/HDL ratio, predominance of small dense LDL particles) is more predictive of cardiovascular events than LDL-C alone.
- Cancer — hyperinsulinemia and elevated IGF-1 stimulate proliferation of multiple cancer cell lines. Epidemiologically, insulin resistance is associated with elevated risk of colorectal, breast (postmenopausal), endometrial, and pancreatic cancer.
- Alzheimer's disease — sometimes called "Type 3 diabetes" for the strong association with insulin resistance. Brain insulin signaling impairment may contribute to the pathology, though the causal direction remains debated.
- Erectile dysfunction — endothelial dysfunction driven by insulin resistance affects penile arteries early in the disease course. ED is often the first symptom of underlying cardiovascular insulin resistance in middle-aged men.
- Acanthosis nigricans — the velvety dark patches in the neck, axillae, and groin folds are a direct skin manifestation of hyperinsulinemia stimulating keratinocyte and fibroblast IGF-1 receptors.
The Reversibility Window (DiRECT, Virta, Counterpoint)
For decades, Type 2 diabetes was characterized as a chronic, progressive disease requiring lifelong medication. Three landmark trials over the past 15 years overturned this framing:
- Lim et al. Counterpoint study (2011) — 11 patients with Type 2 diabetes (mean duration 4 years) underwent an 8-week 600 kcal/day liquid diet. Within 7 days, hepatic insulin sensitivity normalized and fasting glucose returned to normal. By 8 weeks, pancreatic beta cell function had also recovered. 7 of 11 patients achieved diabetes remission (fasting glucose < 7 mmol/L off all medication).
- DiRECT trial (Lean et al. Lancet 2018) — the definitive remission trial. 306 Type 2 diabetes patients in UK primary care randomized to weight management intervention (Total Diet Replacement 825-853 kcal/day for 12-20 weeks, then stepped food reintroduction) vs standard care. At 12 months, 46% of the intervention group achieved diabetes remission off all medication, compared to 4% of controls. Remission rates correlated linearly with weight loss: 86% remission with >15 kg loss, 57% with 10-15 kg, 34% with 5-10 kg.
- Virta Health (Hallberg et al. 2018) — an alternative path to the same endpoint via sustained nutritional ketosis rather than caloric restriction. 218 Type 2 diabetes patients on a continuous-care intervention with very-low-carbohydrate ketogenic diet achieved 60% HbA1c < 6.5% off insulin and oral medications at 1 year, with 94% reduction in insulin use.
The unifying mechanism across all three trials: reducing liver and pancreatic fat below the personal fat threshold, by whatever means (caloric restriction, ketogenic diet, or bariatric surgery), reverses both hepatic insulin resistance and pancreatic beta cell dysfunction. Type 2 diabetes is a metabolic state, not a permanent disease, in most patients whose beta cells have not been irreversibly damaged.
The reversibility window appears to close approximately 10 years after diagnosis. Patients with diabetes duration < 6 years have the highest remission rates. Patients with diabetes duration > 10 years have meaningful but lower remission rates, and patients with severe insulin deficiency (very low fasting C-peptide) may not be able to achieve remission regardless of weight loss because their beta cells are irretrievably damaged.
Practical Reversal Protocols
For patients with confirmed insulin resistance or early Type 2 diabetes, the evidence-based approaches:
- Very-low-carbohydrate ketogenic diet — the Virta Health approach, < 30 g net carbohydrate per day, with adequate protein (1.2-1.5 g/kg ideal body weight) and unlimited natural fats. Restores insulin sensitivity through both calorie reduction and substrate switching to ketosis. Critical to coordinate with prescribers on medication reduction — insulin and sulfonylureas must be reduced or discontinued to avoid hypoglycemia. See our Ketogenic Diet page.
- Total diet replacement (DiRECT protocol) — 825-853 kcal/day liquid meal replacement for 12-20 weeks, then stepped reintroduction of solid food. Requires structured clinical support. The most rapid and reliable path to substantial weight loss and diabetes remission in patients who can tolerate the restriction.
- Time-restricted eating — eating window of 6-10 hours per day, ideally with the eating window in the early/mid day (early time-restricted feeding). Improves insulin sensitivity even without weight loss per Sutton 2018. See our Intermittent Fasting page.
- Mediterranean-style diet plus exercise — the Diabetes Prevention Program approach. Less aggressive than the ketogenic or TDR approaches but with strong long-term evidence. The DPP showed 58% reduction in progression from prediabetes to diabetes with 7% weight loss plus 150 minutes per week of moderate physical activity.
- Bariatric surgery — for severely insulin-resistant patients with BMI > 35 and Type 2 diabetes, Roux-en-Y gastric bypass and vertical sleeve gastrectomy produce diabetes remission rates of 60-80% at 1 year. The mechanism is partly weight loss but also direct effects on gut hormone (GLP-1, PYY) secretion.
- Metformin — the only oral medication that addresses insulin resistance directly (suppresses hepatic gluconeogenesis via AMPK activation). 500-2000 mg daily. Modest weight neutrality or slight loss, low hypoglycemia risk, cheap. The standard first-line pharmacologic agent.
- Berberine — a plant alkaloid with metformin-like mechanism (AMPK activation). 500 mg three times daily has shown comparable HbA1c lowering to metformin in head-to-head trials. See our Berberine page.
- Resistance training — increases muscle mass and GLUT4 expression. The Sigal 2007 trial showed combined aerobic + resistance training produced larger HbA1c reductions than either modality alone.
Key Research Papers
- Reaven GM (1988). Role of insulin resistance in human disease. Banting Lecture. Diabetes. — PubMed
- DeFronzo RA, Tobin JD, Andres R (1979). Glucose clamp technique: a method for quantifying insulin secretion and resistance. Am J Physiol. — PubMed
- Matthews DR et al. (1985). Homeostasis model assessment: insulin resistance and beta-cell function from fasting plasma glucose and insulin concentrations in man. Diabetologia. — PubMed
- Petersen KF, Shulman GI (2006). Etiology of insulin resistance. Am J Med. — PubMed
- Samuel VT, Shulman GI (2012). Mechanisms for insulin resistance: common threads and missing links. Cell. — PubMed
- Stanhope KL et al. (2009). Consuming fructose-sweetened beverages increases visceral adiposity and decreases insulin sensitivity. J Clin Invest. — PubMed
- Taylor R (2013). Type 2 diabetes: etiology and reversibility. Diabetes Care. — PubMed
- Taylor R, Holman RR (2015). Normal weight individuals who develop type 2 diabetes: the personal fat threshold. Clin Sci. — PubMed
- Lim EL et al. (Counterpoint, 2011). Reversal of type 2 diabetes: normalisation of beta cell function in association with decreased pancreas and liver triacylglycerol. Diabetologia. — PubMed
- Lean ME et al. (DiRECT, 2018). Primary care-led weight management for remission of type 2 diabetes (DiRECT): an open-label, cluster-randomised trial. Lancet. — PubMed
- Hallberg SJ et al. (Virta, 2018). Effectiveness and safety of a novel care model for the management of type 2 diabetes at 1 year. Diabetes Ther. — PubMed
- Knowler WC et al. (DPP Research Group, 2002). Reduction in the incidence of type 2 diabetes with lifestyle intervention or metformin. NEJM. — PubMed
PubMed Topic Searches
- PubMed: Insulin resistance/metabolic syndrome
- PubMed: HOMA-IR methodology
- PubMed: T2D remission
- PubMed: NAFLD and IR
- PubMed: PCOS and insulin resistance
Connections
- All Remedies
- Blood Sugar Benefits Hub
- Blood Sugar (Main)
- Glycemic Index & Load
- Continuous Glucose Monitoring
- Exercise & Meal Timing
- Endocrinology
- Metabolic Syndrome
- Insulin Resistance: History and Discovery — how the concept was actually built: Himsworth 1936, the Yalow-Berson radioimmunoassay, DeFronzo’s euglycemic clamp, HOMA-IR, and Reaven’s Syndrome X.
- Ketogenic Diet
- Intermittent Fasting
- Berberine
- Cinnamon
- Chromium
- Magnesium
- Fasting Insulin — the lab test that detects this condition years before glucose or HbA1c turn abnormal, plus the HOMA-IR calculation.
- Lab Tests
- Food
- Metabolic Syndrome: History and Discovery
- Type 2 Diabetes — the downstream diagnosis that arrives 10-20 years after insulin resistance begins, once beta cells stop compensating.
- Isoleucine for Glucose Uptake — the insulin-independent PI3K/GLUT4 route that still works when insulin signaling is blunted, plus the BCAA paradox.
- Fasting Insulin and HOMA-IR: The Overlooked Early-Warning Labs — how to get the tests ordered, what they cost, and how to read the ranges and traps.
- Hemoglobin A1C — the 2-3 month average blood sugar marker that only turns abnormal after insulin resistance has been building for years.
- PCOS — the downstream syndrome in which hyperinsulinemia drives ovarian androgen excess and anovulation in roughly 70% of patients.
- Chromium for Blood Sugar Regulation — the chromodulin and GLUT4 mechanism, plus the supplement trial record.
- HOMA-IR (Insulin Resistance) — the two-number calculation from fasting insulin and glucose, with the formula, the unit traps, and how to read the result.
- Sleep, Stress & Cortisol in Insulin Resistance — short sleep, shift work, apnea, and chronic cortisol drive resistance independently of what you eat.
- Insulin Resistance: The Silent Upstream Driver — the disease-side overview, with testing thresholds, clinical signs, primary drivers, and the reversal framework.
- Reversal Protocol: Diet and Fasting — the DiRECT 5% weight-loss threshold, ketogenic and Mediterranean patterns, time-restricted eating, and protein-sparing modified fasts.
- Metabolic Syndrome and Cardiovascular Risk — what unaddressed insulin resistance costs downstream: the TG/HDL ratio, small-dense LDL, CAC scoring, and why a statin alone is not enough.
- Discussed in depth on these pages: Gestational Diabetes Mellitus · Berberine, AMPK & Metabolic Syndrome · Agaricus Blazei Mushroom for Blood Sugar Support · Inositol: The Versatile Pseudovitamin for Mental Health and Hormonal B