Glycemic Index and Glycemic Load
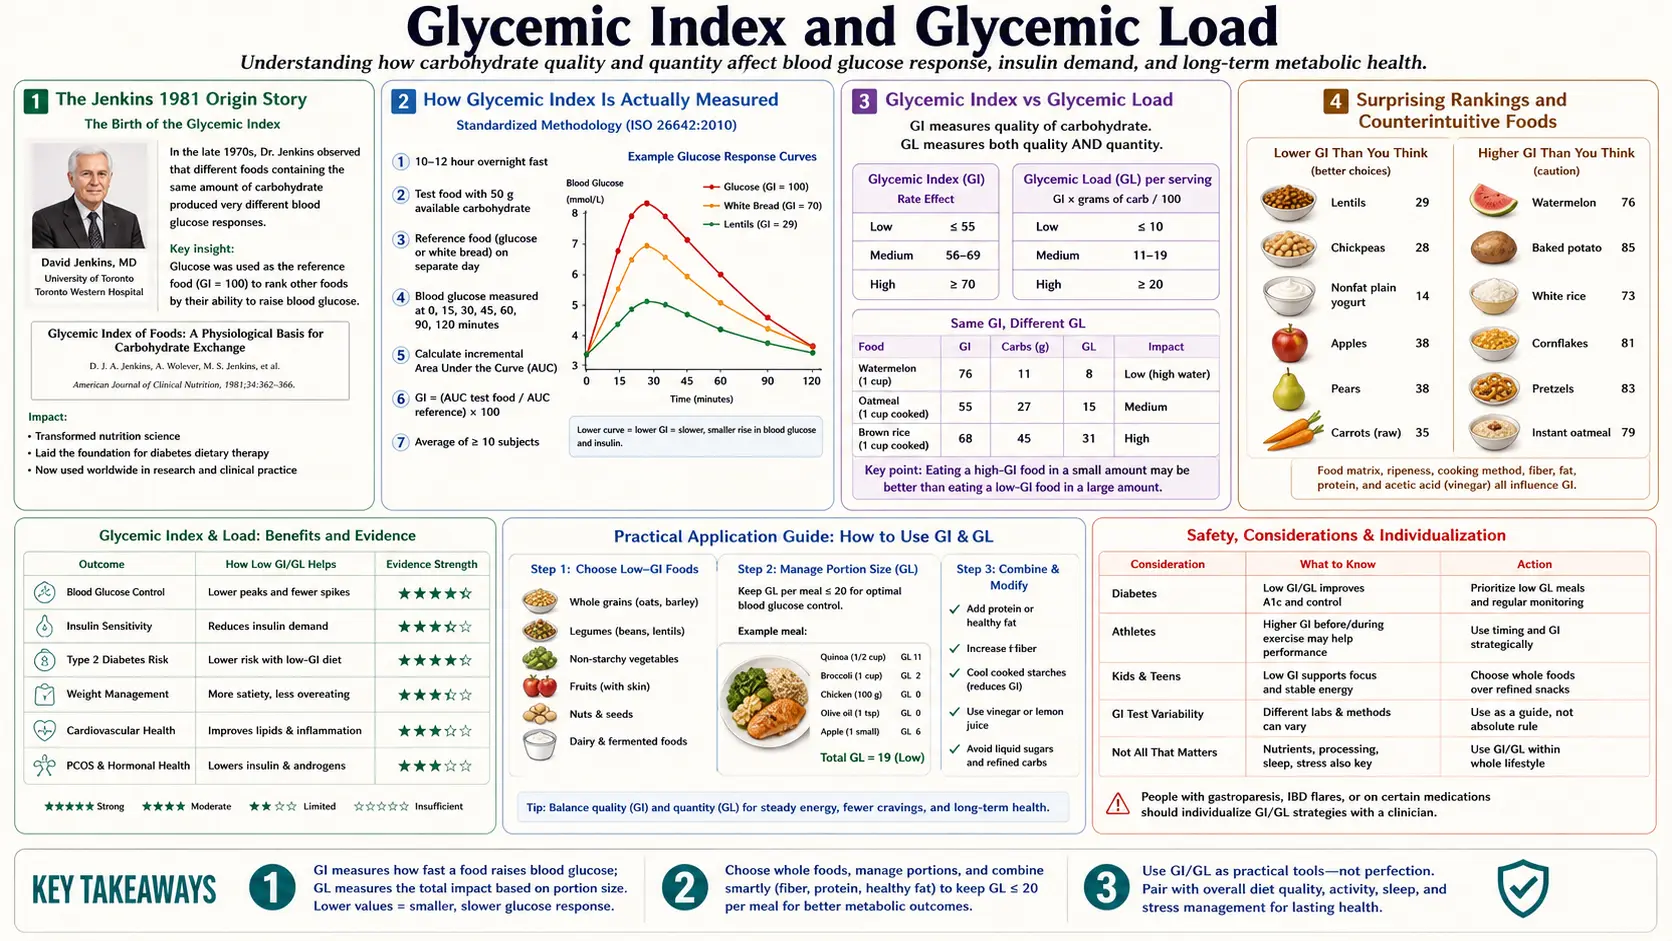
The glycemic index (GI) was introduced by David Jenkins and colleagues at the University of Toronto in 1981 to solve a problem the conventional dietary classification of "simple" vs "complex" carbohydrates could not: a baked potato and a teaspoon of sugar produce nearly identical postprandial glucose responses despite belonging to opposite ends of the simple/complex categorization. GI ranks how rapidly a given test food (containing 50 g available carbohydrate) raises blood glucose compared to a reference (pure glucose or white bread). Glycemic load (GL) corrects GI by serving size — multiplying GI by the grams of carbohydrate actually consumed — and is the more clinically useful metric. This deep-dive walks through the methodology, the surprising rankings (watermelon high GI but low GL; legumes universally low GI), the practical food-matrix exceptions, and the limits of GI/GL in the era of personalized continuous glucose monitoring.
Table of Contents
- The Jenkins 1981 Origin Story
- How GI Is Actually Measured
- Glycemic Index vs Glycemic Load
- Surprising Rankings and Counterintuitive Foods
- What Determines a Food's GI
- Food Matrix Effects and Meal Composition
- Clinical Outcomes Evidence (Diabetes, Cardiovascular, Cancer)
- Limits and Personalization (Why CGM Beats GI)
- Practical Application Without a CGM
- Key Research Papers
- Connections
- Featured Videos
The Jenkins 1981 Origin Story
The conventional dietary advice in the 1960s and 1970s divided carbohydrates into "simple" (mono- and disaccharides — glucose, fructose, sucrose, lactose) and "complex" (polysaccharides — starches and fibers), with the assumption that simple carbohydrates would produce rapid glucose spikes and complex carbohydrates would produce slow, gradual rises. This assumption turned out to be physiologically wrong.
David Jenkins at the University of Toronto tested 62 commonly eaten foods in healthy human volunteers, feeding each subject 50 g of available carbohydrate as the test food and measuring blood glucose every 30 minutes for two hours. He calculated the incremental area under the curve (iAUC) for each food and expressed it as a percentage of the iAUC for an equivalent dose of pure glucose (set arbitrarily to 100). The result was the glycemic index.
The findings overturned the simple/complex framework. Some "complex" starches (baked potato GI 78, instant rice GI 87, white bread GI 75) produced glucose spikes nearly as steep as pure glucose. Some "simple" sugars (fructose GI 19, lactose GI 46) produced very modest spikes. The disconnect was that "complex" refers to molecular structure, while postprandial glucose response depends on how rapidly the digestive system can liberate glucose monomers from the food matrix — a function of starch granule structure, particle size, fat and protein content, fiber content, and pre-existing gelatinization from cooking. The 1981 paper in the American Journal of Clinical Nutrition launched four decades of subsequent epidemiology and clinical trials.
How GI Is Actually Measured
The current ISO 26642:2010 standardized methodology:
- Test subjects — minimum 10 healthy human volunteers per food tested, fasting overnight (12 hours).
- Test dose — exactly 50 g of available carbohydrate (total carbohydrate minus fiber) from the test food. For low-carbohydrate foods, this requires consuming large portions — e.g., 700 g of cooked carrots to deliver 50 g carbohydrate, which is why some GI values are calculated at 25 g and scaled.
- Reference — the same subjects consume 50 g of either pure glucose (preferred, GI = 100 by definition) or white bread (GI ≈ 75) on a different day.
- Blood sampling — capillary or venous glucose at baseline, 15, 30, 45, 60, 90, and 120 minutes (180 minutes for diabetic subjects).
- Calculation — incremental area under the curve (iAUC), with only the area above the fasting baseline counted. The test food iAUC divided by the reference iAUC, multiplied by 100, gives the GI value.
Within-subject variability is large — the same person consuming the same food on different days can produce GI values differing by 25-30%. Between-subject variability is larger still. The published GI value is the mean across all subjects across at least two trials per subject. This is one source of the criticism that GI is a population average that may not apply to any individual person, addressed in our CGM deep-dive.
The reference matrix matters. Glucose-referenced GI values are higher than white-bread-referenced GI values by approximately 1.4× (because white bread is glucose-equivalent × 0.7). The international tables (Atkinson, Foster-Powell, and Brand-Miller 2008) standardize to glucose-reference, but many older studies and many consumer-facing guides use white-bread-reference. Mixing reference frames is a common source of confusion.
Glycemic Index vs Glycemic Load
GI tells you how rapidly the carbohydrate in a food converts to blood glucose, ranked against pure glucose. It does not tell you how much carbohydrate is in a typical serving. This is the gap that glycemic load (GL) fills.
The formula:
GL = (GI / 100) × (grams of available carbohydrate per serving)
The canonical illustrative example: watermelon has a GI of 76 (very high, in the same range as white bread). But a typical 120 g serving of watermelon contains only about 6 g of carbohydrate (watermelon is 92% water by weight). The GL is therefore (76/100) × 6 = 4.6, which is very low. A medium baked potato (150 g) has a GI of 78 and contains about 30 g of carbohydrate, giving a GL of (78/100) × 30 = 23.4 — five times the GL of the watermelon serving despite nearly identical GI.
Conventional GL thresholds:
- Low GL: 10 or less per serving
- Medium GL: 11-19 per serving
- High GL: 20 or more per serving
- Daily total GL: <120 considered low; >200 considered high
For practical decision-making, GL is the more useful metric. GI matters for understanding mechanism (how the food digests), GL matters for predicting the actual glucose response from how you typically eat the food. A high-GI food in small portion is no problem; a low-GI food in massive portion can still spike glucose.
Surprising Rankings and Counterintuitive Foods
Foods that tend to surprise people on first encounter with the GI tables:
- White rice (GI 73) vs sucrose (GI 65) — table sugar produces a smaller glucose spike than white rice, because sucrose is half fructose (which is metabolized in the liver and barely raises blood glucose).
- Watermelon (GI 76) vs carrots (GI 39) — raw carrots are a low-GI food. Cooked carrots rise to GI 47. The cooked-vs-raw difference is gelatinization of the cell-wall pectin.
- Instant oatmeal (GI 79) vs steel-cut oats (GI 55) — processing matters enormously. The smaller the particle size, the larger the surface area exposed to digestive enzymes, the faster the glucose release.
- Whole-wheat bread (GI 74) vs sourdough (GI 53) — the lactic acid fermentation in sourdough slows starch digestion. "Whole wheat" on a label is not predictive of GI.
- Mashed potato (GI 87) vs boiled new potato (GI 56) — mechanical disruption of cell walls during mashing dramatically accelerates glucose release. The same food cooked the same way but mashed differently gives radically different GI.
- Lentils (GI 32) vs lentil flour (GI 78) — intact lentils have low GI because the seed coat and intact cells slow starch hydrolysis. Grinding the same lentils into flour eliminates the food-matrix protection.
- Dates (GI 42) — despite being concentrated dried fruit, the soluble fiber content blunts the glucose response. The GL is moderate at typical serving sizes.
- Glucose (GI 100, by definition) vs maltodextrin (GI ~110) — some hydrolyzed starch products in sports drinks actually have GI greater than glucose. The bonds connecting the glucose units are split so rapidly they release glucose faster than pure dietary glucose.
What Determines a Food's GI
The factors that drive a carbohydrate-containing food's GI, in approximate order of impact:
- Starch type — amylopectin (branched, easily digested by α-amylase) gives high GI. Amylose (linear, more resistant to enzymatic hydrolysis) gives lower GI. Basmati rice has higher amylose than jasmine rice, hence a lower GI (58 vs 89).
- Particle size and processing — the smaller the particle, the higher the surface area exposed to digestive enzymes. Stone-ground flour has lower GI than fine-milled flour. Whole grains have lower GI than refined grains primarily because of particle size, not bran content.
- Gelatinization — raw starch is partially crystalline and resistant to digestion. Cooking with water at >60°C breaks the crystal structure and exposes glucose units. Over-cooked pasta has higher GI than al dente pasta.
- Fiber content — soluble fiber (beta-glucan in oats, pectin in fruit, glucomannan in konjac) increases viscosity in the gut, slowing gastric emptying and starch hydrolysis. Insoluble fiber (cellulose, wheat bran) has smaller effect on GI but improves transit.
- Fat content — fat slows gastric emptying and blunts postprandial glucose response. A boiled potato with butter has lower GI than the same potato eaten plain.
- Protein content — protein delays gastric emptying and stimulates insulin and incretin release independently of carbohydrate, both of which lower postprandial glucose.
- Acidity — lactic acid (sourdough, yogurt) and acetic acid (vinegar) slow gastric emptying and inhibit α-amylase. A salad with vinegar dressing before a starch lowers the meal's effective GI.
- Ripeness — an under-ripe banana (GI 30, mostly resistant starch) has dramatically lower GI than a fully ripe banana (GI 51, starch converted to sucrose and free sugars). This is why green bananas are often recommended for diabetic and prediabetic patients.
- Resistant starch — cooked-and-cooled starches (potato salad, rice cooled overnight then reheated) develop retrograded starch that resists α-amylase, lowering GI. The pasta-cooked-and-cooled technique can reduce GI by 20-25%.
Food Matrix Effects and Meal Composition
GI is measured for a food eaten in isolation. The number on the GI table corresponds to eating 50 g of available carbohydrate from a single source after an overnight fast. Real meals contain mixtures of foods, and the GI of the mixture is not simply the average of the components.
Key meal-composition effects:
- Fat + carbohydrate — adding fat to a starch consistently lowers postprandial glucose. The mechanism is slowed gastric emptying. The price is higher and longer-duration insulin secretion (delayed but sustained spike). This is one reason why "carbohydrate + fat" combinations (pizza, fries, ice cream) are particularly problematic for insulin resistance even though the immediate glucose excursion looks blunted.
- Protein + carbohydrate — protein lowers glucose response by approximately 25% per 30 g of protein added. Whey protein has the largest effect (incretin-mediated). Eating 20-30 g protein before the carbohydrate is more effective than eating it mixed in.
- Fiber + carbohydrate — soluble fiber from psyllium, oats, or legumes reduces glucose response by 15-25% when consumed in the same meal. Insoluble fiber has a smaller effect but improves the longer-term metabolic profile.
- Vinegar + carbohydrate — the Johnston 2010 trials showed 2 tbsp vinegar before a starch meal reduces postprandial glucose AUC by 20%. The mechanism is α-amylase inhibition plus slowed gastric emptying.
- Cinnamon + carbohydrate — the cinnamaldehyde-related compounds modestly inhibit gastric emptying and increase glucose uptake. Effect size is real but smaller than vinegar or fiber. See our Cinnamon page.
The composite effect of "vegetables and protein first, starch last" meal sequencing — covered in our Exercise and Meal Timing deep-dive — produces 30-40% reductions in peak glucose without changing what is eaten, only the order.
Clinical Outcomes Evidence (Diabetes, Cardiovascular, Cancer)
The epidemiologic literature linking low-GI/low-GL diets to better health outcomes is substantial, though not without controversy:
- Type 2 diabetes incidence — the Salmeron HPFS (1997) and NHS (1997) cohorts found relative risk of incident diabetes 1.4-1.5× in the highest GL quintile vs the lowest. The Livesey 2019 dose-response meta-analysis of 20 prospective cohorts confirmed an approximately linear relationship.
- HbA1c reduction in established diabetes — the Brand-Miller 2003 meta-analysis of 14 randomized trials showed average HbA1c reduction of 0.43% on low-GI diets vs control diets, comparable to the effect of single oral hypoglycemic agents.
- Cardiovascular disease — the Liu NHS (2000) cohort found relative risk of myocardial infarction 1.98× in the highest GL quintile vs lowest, restricted to women with BMI ≥ 23. The PURE study (Jenkins et al. NEJM 2024) confirmed a 51% higher risk of CVD/death in the highest GI quintile across 137,851 participants in 20 countries.
- Cancer — the Sieri and Krogh 2017 overview of 47 cohorts found moderate evidence for high-GI/GL association with colorectal, breast, and pancreatic cancer. Mechanism is hypothesized to involve insulin and IGF-1 stimulation of tumor cell proliferation.
- All-cause mortality — the PURE 2024 analysis found 25% higher all-cause mortality in the highest GL quintile, predominantly driven by cardiovascular deaths.
The countervailing evidence: not all randomized weight-loss trials show low-GI diets outperform conventional low-fat diets when calories are matched. The 2014 DIETFITS trial showed similar 12-month weight loss between healthy low-fat and healthy low-carbohydrate arms. The GI/GL effect appears strongest in the context of insulin resistance and is more nuanced in metabolically healthy individuals.
Limits and Personalization (Why CGM Beats GI)
The Zeevi 2015 Cell paper from the Weizmann Institute did the largest-ever real-world test of individual variation in glycemic response. 800 healthy and prediabetic individuals wore continuous glucose monitors for one week each while logging meals via smartphone. The same food (e.g., a standardized banana, white bread, glucose drink) produced wildly different glucose responses in different people — the same food could produce a flat curve in one person and a 100 mg/dL spike in another. The variation correlated with gut microbiome composition, baseline insulin sensitivity, and even time of day.
The implication: published GI tables are population averages that may not apply to any individual. Your personal response to oatmeal, rice, bread, or potatoes can only be reliably learned by measuring it. This is the core argument for continuous glucose monitoring in non-diabetic individuals interested in metabolic optimization.
Other limitations of the GI methodology:
- Measured in healthy young volunteers, not in the diabetic or insulin-resistant subjects most likely to be affected by the choice.
- Within-subject day-to-day variability of 25-30% means the published GI of any single food is uncertain to that degree.
- GI is measured in fasted state; real meals are eaten throughout the day with carryover effects.
- Reference (glucose vs white bread) confusion in the literature.
- Brand-to-brand variation within a single food category (different breads, different rices) can be larger than the published GI uncertainty.
Practical Application Without a CGM
For people who do not have CGM access, the practical takeaways:
- Use GL, not GI — portion size matters more than ranking. The University of Sydney online database (glycemicindex.com) is the most reliable searchable reference.
- Target daily GL < 120, with no single meal exceeding GL 30.
- Favor minimally processed forms — steel-cut oats over instant oats, basmati over jasmine, sourdough over white bread, intact lentils over lentil flour, sweet potato over white potato.
- Apply meal sequencing — vegetables and protein first, starch last. This single change reduces post-meal glucose by 30-40% without changing what is eaten.
- Cook-and-cool starches — pasta and potatoes cooked, refrigerated overnight, then reheated develop resistant starch and have 20-25% lower GI than fresh.
- Add fat, protein, fiber, or acid — nuts with fruit, vinegar dressing on salad before starch, Greek yogurt with berries, full-fat dairy with cereal.
- Avoid "diabetic foods" marketing — many sugar-free, gluten-free, or specialty products have GI values higher than the foods they replace. Read GL, not packaging.
- Test the highest-impact foods on yourself — you can do a poor-man's GI test with a fingerstick meter. Eat the test food in isolation after an overnight fast, measure at 0, 60, and 120 minutes. Peak should ideally stay below 140 mg/dL, and the 2-hour value should return near baseline.
Key Research Papers
- Jenkins DJ et al. (1981). Glycemic index of foods: a physiological basis for carbohydrate exchange. American Journal of Clinical Nutrition. — PubMed
- Atkinson FS, Foster-Powell K, Brand-Miller JC (2008). International tables of glycemic index and glycemic load values: 2008. Diabetes Care. — PubMed
- Salmeron J et al. (1997). Dietary fiber, glycemic load, and risk of non-insulin-dependent diabetes mellitus in women. JAMA. — PubMed
- Brand-Miller J et al. (2003). Low-glycemic index diets in the management of diabetes: a meta-analysis. Diabetes Care. — PubMed
- Augustin LSA et al. (2015). Glycemic index, glycemic load and glycemic response: an International Scientific Consensus Summit. Nutr Metab Cardiovasc Dis. — PubMed
- Zeevi D et al. (2015). Personalized nutrition by prediction of glycemic responses. Cell. — PubMed
- Livesey G et al. (2019). Dietary glycemic index and load and risk of type 2 diabetes: assessment of causal relations. Nutrients. — PubMed
- Jenkins DJA et al. (2024). Glycaemic index, glycaemic load, and cardiovascular disease and mortality (PURE). NEJM. — PubMed
- Liu S et al. (2000). A prospective study of dietary glycemic load, carbohydrate intake, and risk of coronary heart disease in US women. American Journal of Clinical Nutrition. — PubMed
- Sieri S, Krogh V (2017). Dietary glycemic index, glycemic load and cancer: an overview. Nutr Metab Cardiovasc Dis. — PubMed
- Johnston CS et al. (2010). Vinegar and peanut products as complementary foods to reduce postprandial glycemia. J Am Diet Assoc. — PubMed
- Shukla AP et al. (2015). Food order has a significant impact on postprandial glucose and insulin levels. Diabetes Care. — PubMed
PubMed Topic Searches
- PubMed: GI/GL and diabetes
- PubMed: GL and cardiovascular
- PubMed: Resistant starch
- PubMed: Meal sequencing
- PubMed: Personalized glucose response
Connections
- All Remedies
- Blood Sugar Benefits Hub
- Blood Sugar (Main)
- Insulin Resistance
- Continuous Glucose Monitoring
- Exercise & Meal Timing
- Cinnamon
- Berberine
- Chromium
- Magnesium
- Ketogenic Diet
- Intermittent Fasting
- Endocrinology
- Food