Metabolic Syndrome and Cardiovascular Risk
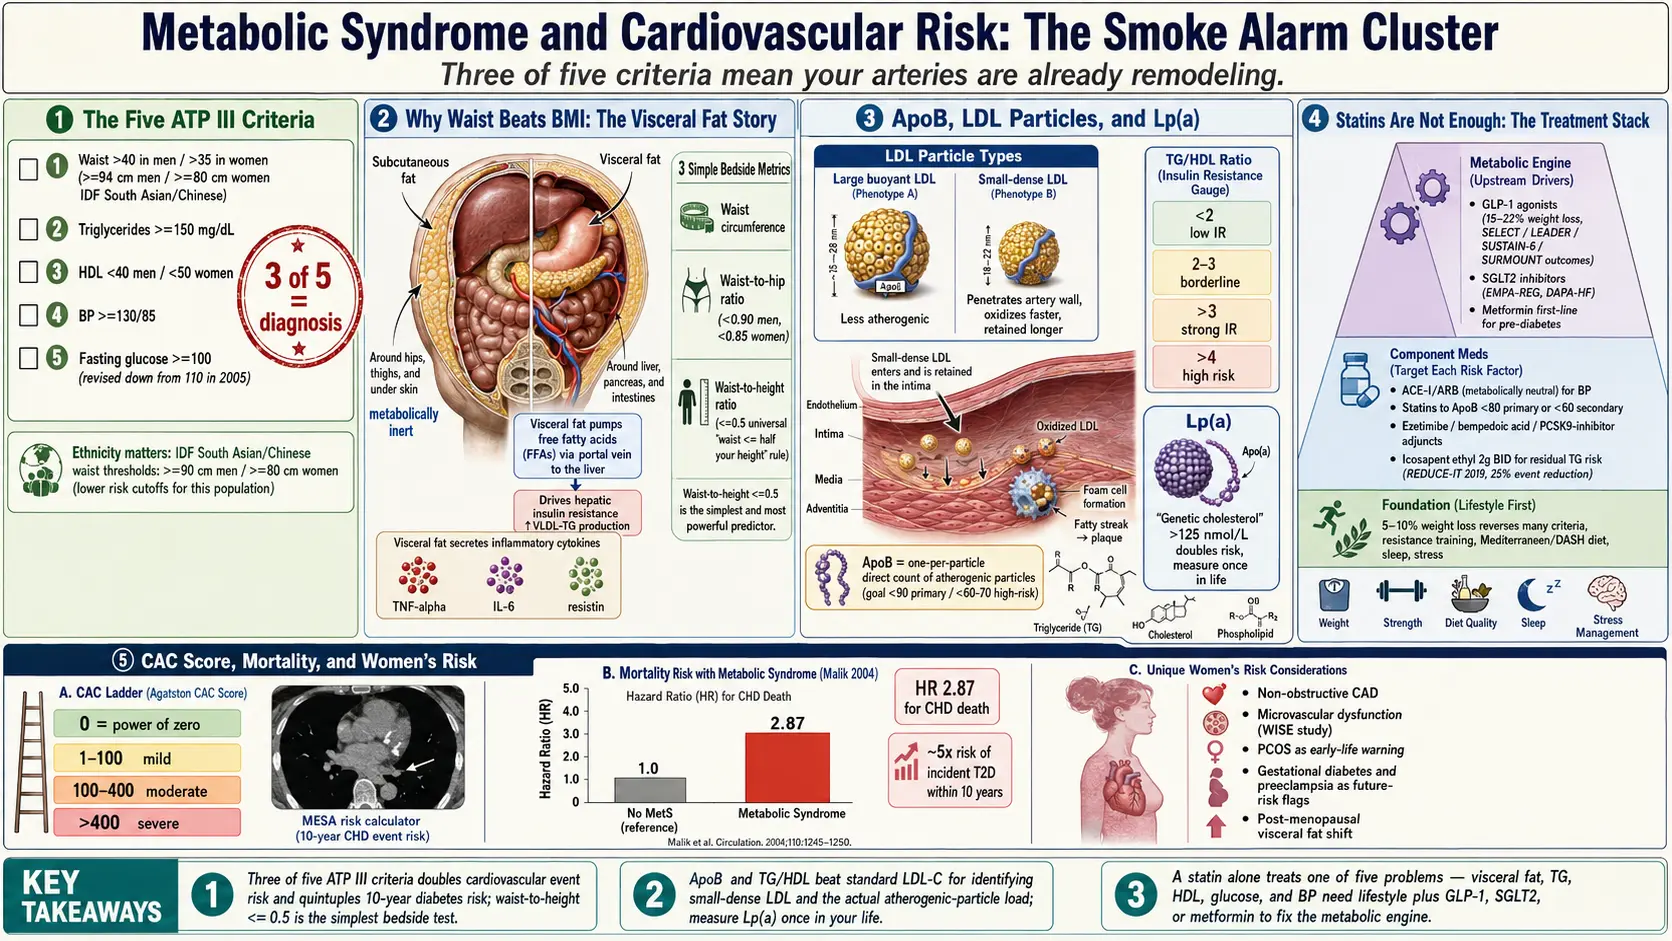
Table of Contents
- What Metabolic Syndrome Actually Is
- The Five Criteria — ATP III and IDF
- Cardiovascular and All-Cause Mortality
- Why Waist Circumference Beats BMI
- The Triglyceride-to-HDL Ratio
- LDL Particle Count, ApoB, and Small-Dense LDL
- Lp(a) — The Genetic Cholesterol
- Why Statins Alone Do Not Fix the Metabolic Engine
- CAC Score, CCTA, and Refining Risk
- Inflammatory and Ancillary Markers
- Treatment Hierarchy — What To Do in What Order
- Women's Risk — Under-Recognized
- ASCVD, PREVENT, and Family History
- Key Research Papers
- Connections
- Featured Videos
What Metabolic Syndrome Actually Is
Metabolic syndrome is not a disease in the way pneumonia or appendicitis is a disease. It is a cluster of findings that travel together because they share a common upstream driver: insulin resistance plus visceral adiposity. When enough of the findings pile up in one person, the ten-year risk of heart attack, stroke, and progression to type 2 diabetes rises steeply. The label exists because clinicians kept noticing that the same patients tended to have central fat, borderline blood pressure, borderline sugar, low HDL, and high triglycerides all at once — and that each of those findings, even at pre-disease levels, added to cardiovascular risk.
Think of it as a smoke alarm for your blood vessels. None of the five individual findings, on its own, is catastrophic. A triglyceride of 160 mg/dL is not going to kill you next week. Neither is a blood pressure of 135/88. But three of those findings together mean your metabolism is actively remodeling your arteries — laying down visceral fat, generating small-dense LDL particles, lowering HDL's protective capacity, raising blood pressure, and nudging fasting glucose upward. Each year you carry that profile is a year of accelerated atherosclerosis.
The Five Criteria — ATP III and IDF
The most widely used definition in the United States is the NCEP ATP III criteria, originally published in 2001 and revised by the American Heart Association and National Heart, Lung, and Blood Institute in 2005 (Grundy et al). You have metabolic syndrome if you meet three of the following five:
- Waist circumference >40 inches (102 cm) in men, >35 inches (88 cm) in women.
- Triglycerides ≥150 mg/dL, or currently on triglyceride-lowering therapy.
- HDL cholesterol <40 mg/dL in men, <50 mg/dL in women, or on therapy.
- Blood pressure ≥130/85 mm Hg, or on antihypertensive therapy.
- Fasting glucose ≥100 mg/dL, or on glucose-lowering therapy.
The 2005 revision is important because it dropped the fasting glucose threshold from 110 to 100 mg/dL — meaning a lot of people who had been "metabolically normal" under the 2001 version woke up one morning meeting criteria. That was intentional. The evidence by then was clear that glucose in the 100–110 range was already doing measurable vascular damage.
The International Diabetes Federation (IDF) 2005 criteria are stricter, especially on waist. The IDF treats central obesity as a required criterion rather than one of five optional ones, and adjusts the waist threshold by ethnicity:
- Europid, Middle Eastern, Sub-Saharan African: ≥94 cm (37 in) men, ≥80 cm (31.5 in) women.
- South Asian, Chinese, South and Central American: ≥90 cm (35.5 in) men, ≥80 cm (31.5 in) women.
- Japanese: ≥90 cm men, ≥80 cm women.
The ethnicity adjustment matters. A South Asian man with a 36-inch waist has more visceral fat and more cardiovascular risk than a Northern European man at the same waist. The IDF criteria recognize that. The ATP III criteria, using a single 40-inch cutoff, systematically undercount metabolic syndrome in South Asian, East Asian, and Hispanic patients. If you are in one of those groups, apply the IDF threshold mentally even if your U.S. doctor does not.
Cardiovascular and All-Cause Mortality
The reason metabolic syndrome gets its own label, rather than being filed under "pre-diabetes plus a few extras," is the hard-endpoint data. Malik et al. 2004, analyzing NHANES II data with twenty-one years of follow-up, found that men with metabolic syndrome had a hazard ratio of 2.87 for coronary heart disease death and 1.40 for all-cause mortality compared with metabolically normal men. Subsequent meta-analyses have landed in the same range: metabolic syndrome roughly doubles the risk of cardiovascular events and increases all-cause mortality by 30–50%.
Diabetes risk is even sharper. People with metabolic syndrome are roughly 5 times more likely to develop type 2 diabetes within ten years than people without. The risk is not linear — each additional component multiplies it. Meeting all five criteria is not twice as bad as meeting three; it is closer to four or five times as bad.
The practical takeaway: if you check three boxes on the ATP III list, you are not "borderline." You are in a high-risk vascular category that merits aggressive lifestyle change and, in most cases, medication to address the specific components.
Why Waist Circumference Beats BMI
BMI is a population metric that works poorly for individuals. It cannot distinguish a muscular 200-pound man with a 32-inch waist from a deconditioned 200-pound man with a 42-inch waist. Their cardiovascular risks are wildly different. The muscular man may be in the best quintile; the deconditioned man is in the worst.
What actually drives metabolic risk is visceral adipose tissue — the fat packed around the liver, pancreas, and intestines. Visceral fat is metabolically active. It pumps free fatty acids directly into the portal vein, driving hepatic insulin resistance, and it secretes inflammatory cytokines (TNF-alpha, IL-6, resistin) that make muscle and liver cells ignore insulin. Subcutaneous fat on the hips and thighs does none of this and is, if anything, mildly protective.
Waist circumference is a rough but cheap surrogate for visceral fat. Measure at the top of the iliac crest, parallel to the floor, at the end of a normal exhale. Do not suck in. Do not measure over clothes. Pair it with one of two ratios for additional signal:
- Waist-to-hip ratio (WHR). Target <0.90 for men, <0.85 for women. Higher ratios indicate central adiposity.
- Waist-to-height ratio (WHtR). Target ≤0.5 for all adults. This is the simplest rule in the lot: your waist should be less than half your height. A 5'10" adult (70 inches) should have a waist under 35 inches. WHtR outperforms BMI in every major study that has compared them for cardiovascular prediction.
If you track one number at home, track waist circumference. It moves faster than weight when you fix insulin resistance through diet and exercise, and it is a better predictor of whether you are actually improving the metabolic engine versus just losing water or muscle.
The Triglyceride-to-HDL Ratio
Of all the ratios you can compute from a standard lipid panel, triglycerides divided by HDL is the single best marker of insulin resistance and small-dense LDL — both of which matter more for heart attack risk than total or LDL cholesterol on their own.
- TG/HDL <2: low insulin resistance, predominantly large buoyant LDL (less atherogenic).
- TG/HDL 2–3: borderline.
- TG/HDL >3: strongly suggestive of insulin resistance and a small-dense LDL phenotype.
- TG/HDL >4: high risk; the metabolic engine is failing.
The threshold is ethnicity-dependent. In Black patients, triglycerides tend to run lower for the same level of insulin resistance, so the cutoff should be >2 rather than >3. Using the generic cutoff undercounts metabolic syndrome in African American patients.
If your TG/HDL is 1.2, you can relax about LDL particle number; your standard lipid panel is telling you most of what you need to know. If your TG/HDL is 5, your standard lipid panel is hiding the problem, and you need advanced testing to see what is actually happening.
LDL Particle Count, ApoB, and Small-Dense LDL
Standard lipid panels report LDL cholesterol (LDL-C), which is an estimate of the mass of cholesterol inside all LDL particles combined. The problem is that particles come in different sizes. You can have 1,000 big fluffy LDL particles carrying a lot of cholesterol, or 2,500 small-dense LDL particles carrying the same total cholesterol. The LDL-C number looks the same. The vascular risk does not.
Small-dense LDL particles penetrate the arterial wall more easily, oxidize faster, and are retained longer. They are the atherogenic workhorse. Insulin resistance and high triglycerides drive the liver to produce them preferentially.
Two better markers than LDL-C:
- LDL particle number (LDL-P). Measured by NMR LipoProfile (LabCorp), Ion Mobility (Quest Cardio IQ), or similar advanced lipid panels. Goal under 1,000 nmol/L for most patients, under 700 for high-risk.
- Apolipoprotein B (ApoB). Every atherogenic particle — LDL, VLDL, IDL, Lp(a) — carries exactly one ApoB molecule. So ApoB in mg/dL is essentially a direct count of the particles that cause atherosclerosis. Sniderman et al. 2019 and every major review since have argued ApoB should replace LDL-C as the primary lipid target. Goal under 90 mg/dL for primary prevention, under 60–70 for high-risk. Cost is about $15–$30; most insurers cover it if coded properly (CPT 82172).
If your LDL-C looks fine but your TG/HDL is high, order an ApoB. You will often find that the LDL-C of 110 mg/dL is actually hiding an ApoB of 120 mg/dL — a particle count that puts you in a much higher risk stratum than the standard panel suggested.
Lp(a) — The Genetic Cholesterol
Lipoprotein(a), pronounced "L-P-little-a," is an LDL particle with an extra protein (apolipoprotein(a)) bolted on. It is strongly genetic, set largely at birth, and unaffected by diet, exercise, or statins. About 20–25% of the general population has elevated Lp(a), and most have no idea.
High Lp(a) independently raises cardiovascular risk by 2–3×, drives calcific aortic valve disease, and contributes to early heart attacks in people with otherwise normal lipids. The threshold of concern is approximately:
- <75 nmol/L (<30 mg/dL): normal.
- 75–125 nmol/L (30–50 mg/dL): borderline.
- >125 nmol/L (>50 mg/dL): high; doubles or triples risk.
- >250 nmol/L: very high; aggressive management of every other risk factor is warranted.
You only need to measure Lp(a) once in your life. It is set genetically and does not meaningfully change. Every adult should have this done at least once — particularly anyone with a family history of early coronary disease, aortic stenosis, or unexplained heart attack before age 55 (men) or 65 (women).
No current drug reliably lowers Lp(a). Niacin nudges it down modestly. PCSK9 inhibitors lower it by 20–30%. The real story is two antisense/siRNA drugs in late-stage trials: pelacarsen (Novartis/Ionis, Phase 3 HORIZON trial) and olpasiran (Amgen, Phase 3 OCEAN(a)-Outcomes). Both lower Lp(a) by 80–98%. If the outcome trials read positive, they will be the first true Lp(a)-specific therapy approved. Until then, people with high Lp(a) should aggressively treat every other modifiable risk factor — ApoB, blood pressure, visceral adiposity, and smoking — to compensate.
Why Statins Alone Do Not Fix the Metabolic Engine
Statins work. They lower LDL-C and ApoB by blocking HMG-CoA reductase in the liver, and they have additional pleiotropic effects — reducing vascular inflammation, stabilizing existing plaque, and improving endothelial function. Every major primary- and secondary-prevention trial of the last thirty years has shown that statins cut cardiovascular events by roughly 25% per 40 mg/dL of LDL-C lowered. The benefit is real and should not be dismissed.
But statins do not fix insulin resistance. They do not shrink visceral fat. They do not raise HDL meaningfully. They do not lower triglycerides by much. They do not touch Lp(a). And at higher doses, some statins mildly worsen fasting glucose and modestly increase the incidence of new-onset type 2 diabetes — a trade-off that is worth it in higher-risk patients but still a real effect.
The point is not that statins are bad. The point is that if you have metabolic syndrome, a statin alone treats one out of five problems. You still have the visceral fat, the high triglycerides, the low HDL, the rising glucose, and the blood pressure creep. Those require metabolic interventions — diet, exercise, sleep, and in many cases medications that target the metabolic engine directly (GLP-1 agonists, SGLT2 inhibitors, metformin). A patient on a statin whose ApoB is now 75 mg/dL but whose waist is 44 inches and HbA1c is 6.2% is not "fixed." They are partially treated.
CAC Score, CCTA, and Refining Risk
When you are stuck in the middle of a risk calculator — ten-year ASCVD risk of, say, 8% — imaging can tell you whether your arteries are actually behaving like an 8% person or like a 25% person. Two tools:
Coronary Artery Calcium (CAC) score. A low-radiation non-contrast CT of the chest that counts and quantifies calcified plaque in the coronary arteries. Cost $75–$200 out of pocket in the United States (most insurers do not cover it yet, though that is changing). Results are reported as an Agatston score:
- 0: no detectable calcified plaque. Ten-year event risk very low — often below 1%. The "power of zero" is real.
- 1–100: mild plaque. Intermediate risk.
- 100–400: moderate plaque. High risk; aggressive prevention warranted.
- >400: severe plaque. Very high risk; statin indicated regardless of LDL-C.
The MESA Risk Calculator (mesa-nhlbi.org) lets you plug in your numbers and compare predicted versus actual plaque. A 55-year-old with metabolic syndrome and a CAC of 0 can reasonably defer aggressive drug therapy. The same patient with a CAC of 300 needs a statin now.
Coronary CT Angiography (CCTA) goes further, using contrast to visualize the artery lumen and characterize plaque as calcified, non-calcified, or mixed. The SCOT-HEART and PROMISE trials showed CCTA-guided management improves outcomes in stable chest pain. Cost is higher ($500–$2,000) and it is typically reserved for patients with symptoms or an elevated CAC.
Inflammatory and Ancillary Markers
A few additional labs sharpen the picture:
- hsCRP (high-sensitivity C-reactive protein): a nonspecific inflammation marker. Under 1 mg/L is low risk, 1–3 intermediate, over 3 high. Elevated hsCRP in the setting of metabolic syndrome amplifies cardiovascular risk and identifies patients most likely to benefit from anti-inflammatory therapy (colchicine, as tested in LoDoCo2 and COLCOT).
- Ferritin: elevated in inflammatory states (and in hereditary hemochromatosis). Mildly elevated ferritin in metabolic syndrome is a surrogate for hepatic inflammation and fatty liver. Dramatically elevated ferritin warrants iron-studies workup.
- Homocysteine: elevated levels are mildly associated with cardiovascular risk; B-vitamin repletion lowers the number but has not consistently lowered events in trials. Worth checking once; not worth chasing aggressively.
- Uric acid: insulin resistance reduces renal clearance of urate, so high-normal or high uric acid often travels with metabolic syndrome, predisposes to gout, and independently correlates with hypertension and kidney disease. Fructose consumption in particular drives both insulin resistance and uric acid.
Treatment Hierarchy — What To Do in What Order
Metabolic syndrome is reversible. The hierarchy matters because the interventions stack, and skipping the foundation makes every drug on top of it less effective.
1. Lifestyle first, always. Nothing substitutes for losing visceral fat through diet change and exercise. Even a 5–10% weight loss reverses many of the criteria. See the sibling Diet Strategy and Exercise Protocol articles for the details. Sleep and stress also matter: see Sleep & Stress.
2. Treat the specific components that remain.
- Blood pressure: ACE inhibitor or ARB as first-line, especially in diabetic or pre-diabetic patients, because they are renoprotective and metabolically neutral. Thiazides and beta-blockers can mildly worsen glucose and should be used more cautiously in metabolic syndrome.
- Glucose and weight: GLP-1 receptor agonists (semaglutide, tirzepatide) produce 15–22% weight loss and reduce major cardiovascular events (SELECT, LEADER, SUSTAIN-6, SURMOUNT). SGLT2 inhibitors (empagliflozin, dapagliflozin) reduce cardiovascular death and heart-failure hospitalization in type 2 diabetes, independent of glucose lowering (EMPA-REG, DAPA-HF, EMPEROR). Metformin remains useful as first-line in pre-diabetes and type 2.
- LDL/ApoB: statin at the dose needed to reach ApoB <80 (primary prevention) or <60 (secondary prevention or high risk). Add ezetimibe, bempedoic acid, or a PCSK9 inhibitor if the statin alone is insufficient.
- Residual triglyceride risk: icosapent ethyl (EPA) 2 g twice daily reduced cardiovascular events by 25% in patients with high triglycerides already on statins in the REDUCE-IT trial (Bhatt et al. 2019). This is a specific EPA-only formulation, not fish oil from the supplement aisle — combination EPA/DHA products failed in STRENGTH.
See Medications and GLP-1 for the prescribing detail on each drug class.
Women's Risk — Under-Recognized
Historically, metabolic syndrome and coronary disease were studied primarily in men, and women's cardiovascular risk has been under-recognized as a result. A few specifics:
- Non-obstructive CAD. Women are more likely than men to have diffuse, non-obstructive coronary disease — plaque that narrows arteries modestly without producing the focal 70% stenosis that triggers an abnormal stress test. They get told their angiogram was "clean" and sent home, then present with a heart attack months later.
- Microvascular dysfunction. The WISE study (Women's Ischemia Syndrome Evaluation) documented that a large fraction of women with chest pain and no obstructive disease on angiography have coronary microvascular dysfunction — impaired dilation of the small arterioles that actually feed heart muscle. This is a real cause of angina and of adverse outcomes, and it tracks with metabolic syndrome.
- PCOS as an early warning. Polycystic ovary syndrome is essentially metabolic syndrome presenting in the reproductive years. Women with PCOS should be screened early and repeatedly for the full metabolic-syndrome panel. See the sibling PCOS Connection article.
- Pregnancy history. Gestational diabetes, preeclampsia, and pregnancy-induced hypertension all flag future cardiovascular risk. Ask about them when taking a history; they are routinely skipped.
- Post-menopausal shift. Visceral fat accumulation accelerates in the years around menopause as estrogen falls. Waist, triglycerides, and blood pressure can all drift into metabolic-syndrome territory within five years of the last period in a woman who was previously metabolically healthy.
ASCVD, PREVENT, and Family History
Two calculators estimate your ten-year cardiovascular risk:
- ACC/AHA ASCVD Risk Estimator Plus (tools.acc.org) — the 2013 Pooled Cohort Equations. Widely used; systematically overestimates risk in some contemporary populations.
- AHA PREVENT 2023 equations (professional.heart.org/en/guidelines-and-statements/prevent-calculator) — the newer replacement, incorporating kidney function, metabolic factors, and social determinants; predicts ten- and thirty-year risk for ASCVD, heart failure, and their composite. PREVENT estimates are generally lower than ASCVD for the same patient and are probably more accurate for current populations.
Neither calculator captures Lp(a) or family history adequately. If you have a first-degree relative (parent or sibling) with early coronary disease — heart attack, bypass, or stent before age 55 in men or 65 in women — add approximately 1.5–2× to whatever the calculator says. Early family history is one of the strongest independent risk factors and is not fully modeled.
The honest summary: calculators estimate probability; CAC imaging shows what is actually happening in your arteries; ApoB and Lp(a) show the particles driving it; and waist, TG/HDL, and fasting glucose show whether the metabolic engine is still running hot. Use all of them together, not any one in isolation.
Key Research Papers
Foundational publications defining metabolic syndrome diagnostic criteria, quantifying its cardiovascular risk burden, and demonstrating that ApoB — not LDL-C — is the most accurate atherogenic-particle marker. Each citation links to the full text via DOI.
- Expert Panel on Detection, Evaluation, and Treatment of High Blood Cholesterol in Adults. Executive Summary of the Third Report of the National Cholesterol Education Program (NCEP) Adult Treatment Panel III (ATP III). JAMA. 2001;285(19):2486–2497.
- Grundy SM, Cleeman JI, Daniels SR, et al. Diagnosis and Management of the Metabolic Syndrome: An American Heart Association/National Heart, Lung, and Blood Institute Scientific Statement. Circulation. 2005;112(17):2735–2752.
- Alberti KGMM, Eckel RH, Grundy SM, et al. Harmonizing the Metabolic Syndrome: A Joint Interim Statement of the IDF, NHLBI, AHA, WHF, IAS, and IASO. Circulation. 2009;120(16):1640–1645.
- Mottillo S, Filion KB, Genest J, et al. The Metabolic Syndrome and Cardiovascular Risk: A Systematic Review and Meta-Analysis. Journal of the American College of Cardiology. 2010;56(14):1113–1132.
- Malik S, Wong ND, Franklin SS, et al. Impact of the Metabolic Syndrome on Mortality from Coronary Heart Disease, Cardiovascular Disease, and All Causes in United States Adults. Circulation. 2004;110(10):1245–1250.
- Sniderman AD, Thanassoulis G, Glavinovic T, et al. Apolipoprotein B Particles and Cardiovascular Disease: A Narrative Review. JAMA Cardiology. 2019;4(12):1287–1295.
- Bhatt DL, Steg PG, Miller M, et al. Cardiovascular Risk Reduction with Icosapent Ethyl for Hypertriglyceridemia (REDUCE-IT). New England Journal of Medicine. 2019;380(1):11–22.
- Reaven GM. Banting Lecture 1988. Role of Insulin Resistance in Human Disease. Diabetes. 1988;37(12):1595–1607.
- Petersen MC, Shulman GI. Mechanisms of Insulin Action and Insulin Resistance. Physiological Reviews. 2018;98(4):2133–2223.
- Saltiel AR, Olefsky JM. Inflammatory Mechanisms Linking Obesity and Metabolic Disease. Journal of Clinical Investigation. 2017;127(1):1–4.
- Marso SP, Daniels GH, Brown-Frandsen K, et al. Liraglutide and Cardiovascular Outcomes in Type 2 Diabetes (LEADER). New England Journal of Medicine. 2016;375(4):311–322.
- Zinman B, Wanner C, Lachin JM, et al. Empagliflozin, Cardiovascular Outcomes, and Mortality in Type 2 Diabetes (EMPA-REG OUTCOME). New England Journal of Medicine. 2015;373(22):2117–2128.
Live PubMed Searches
Live PubMed queries that update as new papers are indexed.
- PubMed: metabolic syndrome and CV mortality
- PubMed: waist circumference and visceral adiposity
- PubMed: triglyceride-to-HDL ratio
- PubMed: apolipoprotein B and CV risk
- PubMed: lipoprotein(a) and CVD
- PubMed: coronary artery calcium and MESA
- PubMed: GLP-1 agonists and CV outcomes
- PubMed: SGLT2 inhibitors and heart failure
- PubMed: women and microvascular coronary disease
- PubMed: AHA PREVENT equations
Connections
- Blood Sugar & Insulin — interactive animation
- Reversal Protocol: Diet and Fasting
- CGM for Non-Diabetics
- Insulin Resistance and PCOS
- Metformin, Berberine and GLP-1s
- Exercise and Muscle Insulin Sensitivity
- Insulin Resistance
- Metabolic Syndrome
- Diabetes
- Hypertension
- Fasting Insulin and HOMA-IR Testing
- Coronary Artery Disease
- ApoB
- Cardiovascular Disease
- Atherosclerosis
- Lipid Panel
- Visceral Fat
- Uric Acid
- Polycystic Ovary Syndrome
- Blood Sugar Support for Insulin Resistance — the food-and-supplement side of lowering the insulin resistance that drives every metabolic syndrome criterion on this page.