Fasting Insulin and HOMA-IR: The Overlooked Early-Warning Labs
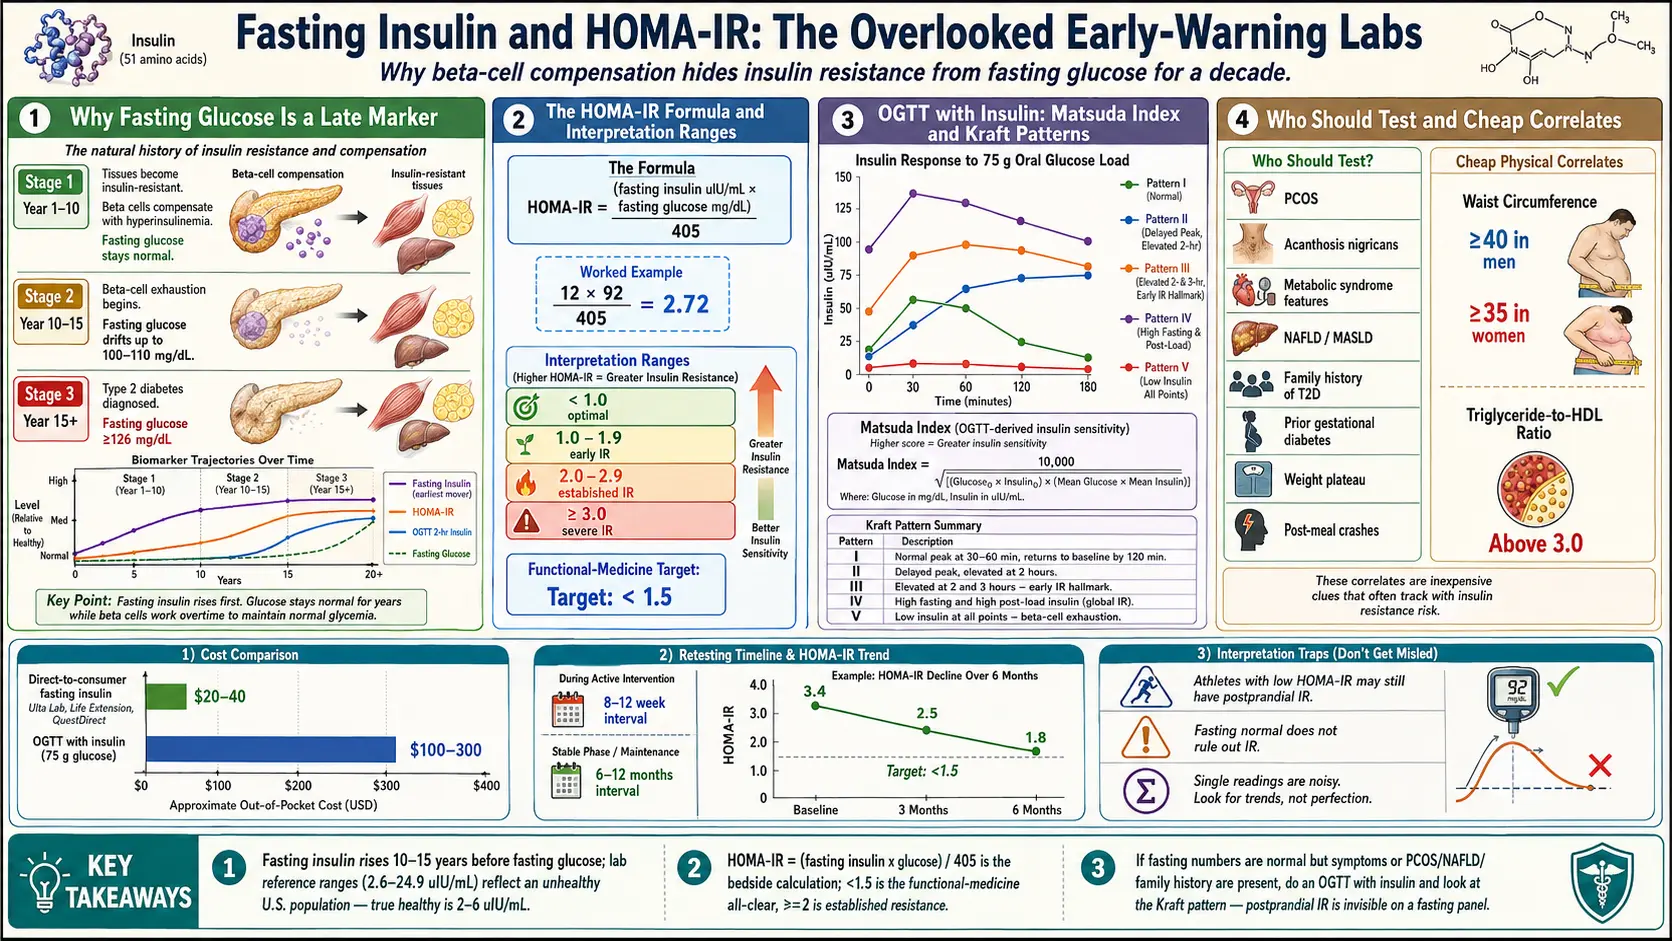
Table of Contents
- Why Fasting Glucose Is a Late Marker
- Fasting Insulin — The Earliest Mover
- HOMA-IR — The Formula and What It Means
- Interpretation Ranges (and Why Your Lab's Number Isn't the Whole Story)
- QUICKI — The Logarithmic Cousin
- OGTT With Insulin and the Matsuda Index
- Kraft Patterns — Seeing the Shape of Your Insulin Response
- How to Actually Get These Labs Ordered
- Who Should Test — And When
- Fasting Prep and Draw-Day Details
- Interpretation Traps — Athletes, Postprandial IR, and One-Off Readings
- Correlating With Waist, Triglycerides, and HDL
- Retesting Cadence and Tracking Trends
- Where the CGM Comes In
- Key Research Papers
- Connections
- Featured Videos
Why Fasting Glucose Is a Late Marker
If you have ever walked out of an annual physical with a "normal" fasting glucose and been told everything looks fine, there is a very good chance you were reassured prematurely. Fasting glucose is the single most ordered metabolic lab in the United States — and it is also one of the last markers to become abnormal along the road from healthy metabolism to type 2 diabetes.
The reason is biology, not lab error. Your pancreas is a compensating organ. When your muscle, liver, and fat cells start resisting insulin's signal — the earliest physiological step in insulin resistance — your beta cells respond by pumping out more insulin to force the message through. For years, sometimes decades, this extra insulin succeeds in dragging glucose back into cells and keeping your fasting glucose inside the "normal" 70–99 mg/dL range. You look fine on paper. You feel the symptoms anyway — afternoon energy crashes, stubborn belly fat, brain fog after meals, mid-morning sugar cravings — but the lab sheet says nothing is wrong.
Only when the beta cells can no longer keep up — a process called beta-cell exhaustion — does fasting glucose finally drift up. By the time a reading of 100 or 110 shows up on a standard panel, most people have been insulin-resistant for 5 to 15 years. The window for easy reversal is already narrowing. Catching the problem earlier means measuring insulin itself, not just the glucose that insulin is working overtime to control.
Fasting Insulin — The Earliest Mover
Fasting insulin is exactly what it sounds like: a blood draw after 8 to 12 hours without food that measures how much insulin your pancreas is releasing just to maintain baseline glucose. It is reported in micro-international units per milliliter (µIU/mL), sometimes written µU/mL. Some labs report in pmol/L — divide by 6 to convert approximately to µIU/mL.
In a metabolically healthy adult with normal insulin sensitivity, fasting insulin typically sits around 2–6 µIU/mL. Standard lab "reference ranges" often list 2.6–24.9 µIU/mL as normal — but that range reflects the population the lab sees, which in the United States is heavily insulin-resistant. A fasting insulin of 18 is inside the lab's reference range and also strongly suggestive of metabolic dysfunction. This is one of the clearest cases in modern medicine where "within the reference range" and "healthy" are not the same thing.
Fasting insulin rises first — before fasting glucose, before HbA1c, before triglycerides, before anything your primary care doctor is likely to be tracking. If you could only order one metabolic lab for early detection, this would be a defensible choice.
HOMA-IR — The Formula and What It Means
Fasting insulin alone tells you how hard your pancreas is working. HOMA-IR — the Homeostatic Model Assessment of Insulin Resistance — combines that number with your fasting glucose to estimate how resistant your tissues have become. The model was published by Matthews and colleagues in 1985 and is still the most widely cited surrogate marker for insulin resistance in clinical research.
The formula is simple enough to do on your phone:
HOMA-IR = (fasting insulin in µIU/mL × fasting glucose in mg/dL) / 405
If your lab reports glucose in mmol/L, divide by 22.5 instead of 405. The math is the same; only the constant changes to match units.
An example. Your fasting insulin comes back at 12 µIU/mL. Your fasting glucose is 92 mg/dL. Your HOMA-IR is (12 × 92) / 405 = 2.72. Your primary care doctor looks at the glucose alone and tells you everything is normal. HOMA-IR puts you firmly into established insulin resistance.
The number is a ratio, not a unit. What it represents is the product of two things: how much insulin you need at rest (beta-cell workload) and how well that insulin is clearing glucose (tissue response). The higher the number, the worse both problems are.
Interpretation Ranges (and Why Your Lab's Number Isn't the Whole Story)
There is no universally agreed HOMA-IR cutoff. Different populations, different insulin assays, and different research groups publish different thresholds. The ranges below reflect a reasonable consensus across the functional-medicine and endocrinology literature:
- < 1.0 — Optimal insulin sensitivity. Seen in lean, active adults, children, and the metabolically healthy.
- 1.0 – 1.9 — Early insulin resistance. Often asymptomatic. A reasonable point to intervene with diet, sleep, and training before things progress.
- 2.0 – 2.9 — Established insulin resistance. Strongly associated with metabolic syndrome features, NAFLD, PCOS, and a rising cardiovascular risk profile.
- ≥ 3.0 — Severe insulin resistance. Prediabetes or diabetes is often already present or imminent.
Many functional-medicine practitioners target a HOMA-IR below 1.5 as the real "all clear," not 2.0. The reasoning is that large observational studies consistently show cardiovascular and metabolic risk starting to climb between 1.5 and 2.0, well before patients would be flagged by conventional cutoffs.
Two cautions. First, the assay matters. Different labs use different antibodies and calibrations, and a HOMA-IR of 2.0 at LabCorp is not perfectly interchangeable with 2.0 at Quest. If you are trending your own numbers over time, use the same lab every time. Second, the number is only one data point. A HOMA-IR of 1.8 in a slim person with excellent triglycerides, low waist circumference, and strong muscle mass is a different story than the same number in someone with a 40-inch waist and fatty liver.
QUICKI — The Logarithmic Cousin
The Quantitative Insulin Sensitivity Check Index (QUICKI) was introduced by Katz and colleagues in 2000 as a refinement of HOMA. It uses the same two inputs — fasting insulin and fasting glucose — but runs them through a logarithmic transformation:
QUICKI = 1 / [log(fasting insulin) + log(fasting glucose)]
Because the log compresses the high end of the scale, QUICKI tends to correlate slightly better with gold-standard clamp studies in people who are already insulin-resistant. Interpretation is the reverse of HOMA — higher QUICKI means better sensitivity. Healthy adults usually fall around 0.38 or above; anything below roughly 0.33 is generally considered insulin-resistant.
In everyday practice, HOMA-IR and QUICKI tell you the same story. Pick one and stick with it. Most U.S. clinicians default to HOMA-IR because the number intuitively rises with worsening disease.
OGTT With Insulin and the Matsuda Index
Fasting numbers miss one critical thing: what happens after you actually eat. Some people — particularly early in the disease process — have perfectly reasonable fasting insulin and glucose, but completely dysfunctional responses to a meal. This is postprandial insulin resistance, and it is invisible to any fasting-only test.
The classical way to unmask it is an Oral Glucose Tolerance Test (OGTT) with insulin levels. You drink 75 grams of glucose and the lab draws blood at fasting baseline, 30 minutes, 60 minutes, 90 minutes, and 120 minutes. Each draw measures both glucose and insulin. Most U.S. labs offer this as a send-out; cash cost runs $100–$300.
The Matsuda Index, published by Matsuda and DeFronzo in 1999, uses the full OGTT to calculate whole-body insulin sensitivity. It correlates far more tightly with hyperinsulinemic-euglycemic clamp studies (the true research gold standard) than HOMA-IR does. The math is uglier — you won't do it on your phone — but most lab reports or online calculators will compute it for you from the five time points.
The Matsuda Index is especially useful when fasting numbers look borderline and you want a definitive read on whether real resistance is present. It is also the right test when someone has a strong family history of diabetes, PCOS, or gestational diabetes but normal fasting labs.
Kraft Patterns — Seeing the Shape of Your Insulin Response
Dr. Joseph Kraft, a pathologist who spent decades running OGTTs with insulin on more than 15,000 patients, catalogued five distinct patterns of insulin response. The Kraft patterns are not part of standard clinical teaching, but they are useful for visualizing what insulin resistance looks like over time:
- Pattern I — Normal. Insulin peaks at 30–60 minutes, then returns to baseline by 120 minutes. Peak is modest.
- Pattern II — Delayed peak with elevated 2-hour. The first-phase insulin release is blunted; the peak shifts right and stays up.
- Pattern III — Elevated 2- and 3-hour. More pronounced delay; insulin is still climbing when glucose has fallen. A hallmark of early IR.
- Pattern IV — Markedly elevated fasting and all post-load values. Established hyperinsulinemia.
- Pattern V — Low insulin at all time points. Beta-cell exhaustion or type 1 / late-stage type 2 diabetes. The pancreas has stopped compensating.
A delayed insulin peak — insulin still climbing at 60 or 90 minutes when a healthy pancreas would already be tapering down — is one of the earliest reliable signals of insulin resistance, often appearing years before fasting glucose or HbA1c budge. If you can get a full 3-hour OGTT with insulin, ask the lab to include the 0, 30, 60, 90, 120, and 180-minute insulin values and plot the curve. The shape of the curve tells you more than any single number.
How to Actually Get These Labs Ordered
Fasting insulin is not on any standard metabolic panel in the United States. The Comprehensive Metabolic Panel (CMP), Basic Metabolic Panel (BMP), and lipid panel all skip it. You have to ask specifically.
Through your primary care doctor. Ask by name: "I'd like to add a fasting insulin to my next draw." Insurance typically covers it when paired with a diagnosis code such as metabolic syndrome (E88.81), obesity (E66.9), PCOS (E28.2), acanthosis nigricans (L83), NAFLD (K76.0), impaired fasting glucose (R73.01), or family history of diabetes (Z83.3). If your doctor balks, phrase it as screening: "Given my family history and waist circumference, I'd like to rule out hyperinsulinemia before fasting glucose becomes abnormal."
Direct-to-consumer cash pay. Services like Ulta Lab Tests, Life Extension, QuestDirect, and Marek Health let you order fasting insulin without a physician visit. Cash cost typically runs $20–$40. A fasting insulin plus fasting glucose (needed to calculate HOMA-IR) is usually under $50 total. This is the fastest path if your doctor is not receptive.
OGTT with insulin is harder to get cash — most labs require a physician order — and runs $100–$300. Functional medicine clinics and some endocrinology practices order it routinely.
Who Should Test — And When
Anyone with any of the following is a reasonable candidate for fasting insulin and HOMA-IR, regardless of what their fasting glucose shows:
- PCOS — insulin resistance is part of the core pathophysiology. See IR and PCOS.
- Acanthosis nigricans — the dark, velvety skin thickening on the back of the neck, armpits, or groin is one of the most specific external signs of hyperinsulinemia.
- Metabolic syndrome features — waist circumference ≥ 40 inches (men) or ≥ 35 inches (women), triglycerides ≥ 150 mg/dL, HDL < 40 (men) or < 50 (women), blood pressure ≥ 130/85, or fasting glucose ≥ 100.
- NAFLD / MASLD — fatty liver is essentially hyperinsulinemia of the liver until proven otherwise. See the NAFLD/MASLD connection.
- Family history of type 2 diabetes — parent or sibling with T2D doubles your own risk, often with a 10–20 year head start on the disease.
- History of gestational diabetes (GDM) — roughly half of women with GDM develop type 2 diabetes within a decade. Fasting insulin picks up the drift years before HbA1c does.
- Weight plateau despite sensible diet and training. Stubborn truncal fat and blunted results from calorie restriction are classic hyperinsulinemia signatures.
- Strong cravings, post-meal crashes, and reactive hypoglycemia symptoms — especially in otherwise healthy-appearing people with "normal" glucose.
Fasting Prep and Draw-Day Details
Fasting insulin is only meaningful if you actually fasted. A few ground rules:
- 8–12 hours of water-only fasting. Less than 8 gives you a half-fed number. More than 14–16 can artificially depress insulin and mask resistance. Overnight fasts (finish dinner by 8 pm, draw at 8 am) are ideal.
- No coffee, tea, gum, or "just a little cream" before the draw. Caffeine alone can shift insulin modestly; any calorie-containing food destroys the test.
- Water is fine, and encouraged. Mild dehydration can make the draw harder and shifts hematocrit.
- Avoid heavy exercise the day of and the night before. Vigorous training transiently increases insulin sensitivity and can pull your fasting number down 10–30%.
- Illness, acute stress, poor sleep, and menstrual cycle phase all modestly affect insulin. If the draw is for trend tracking, try to control these variables between draws.
- If you take metformin, berberine, or a GLP-1, your numbers reflect the drug, not your unmedicated physiology. Note this on the lab order. See Metformin, Berberine, and GLP-1s.
Interpretation Traps — Athletes, Postprandial IR, and One-Off Readings
Three mistakes are common enough to deserve their own warnings.
Trap 1: Athletes with low insulin and normal HOMA-IR. A highly trained endurance athlete may have a fasting insulin of 3 and a fasting glucose of 95, giving a HOMA-IR of 0.7. That is excellent. It does not mean their metabolism is bulletproof — high-volume endurance training plus a high-carbohydrate diet can still produce postprandial hyperinsulinemia that an OGTT with insulin would catch. If symptoms do not match the fasting picture, go to the OGTT.
Trap 2: Normal fasting numbers do not rule out IR. This is the mirror image. Early insulin resistance often shows up first as an exaggerated insulin response after meals, with fasting values still compensated. If you have PCOS, NAFLD, acanthosis nigricans, or a strong family history, and your fasting panel looks clean, do not stop there. An OGTT with insulin or a two-week CGM is the next step.
Trap 3: Treating one reading as a diagnosis. A single high fasting insulin is not type 2 diabetes. It is not even a diagnosis of insulin resistance by itself. Insulin is a noisy analyte — values vary with sleep, stress, recent meals, illness, menstrual phase, and even assay drift between lab batches. You want at least two or three readings over a few months that tell the same story before you build a treatment plan around them. The trend matters more than any single data point.
Correlating With Waist, Triglycerides, and HDL
HOMA-IR is more trustworthy when it agrees with the physical and lipid picture. Two cheap correlates make the interpretation much more confident:
Waist circumference. Measure at the level of the navel, at the end of a normal exhale, with the tape horizontal. A waist ≥ 40 inches in men or ≥ 35 inches in women strongly predicts visceral adiposity and insulin resistance. Waist is a better screen than BMI because it focuses on the metabolically dangerous fat around the liver and pancreas.
Triglyceride-to-HDL ratio. Divide your fasting triglycerides by your HDL (both in mg/dL). A ratio above 3.0 is a robust surrogate for insulin resistance in most populations; above 3.5 is stronger still. (The ratio is less reliable in people of African ancestry, where triglycerides run lower for metabolic reasons; use HOMA-IR directly instead.) A low TG/HDL ratio with a borderline HOMA-IR is reassuring. A high ratio with a borderline HOMA-IR is confirmation.
Add fasting glucose, HbA1c, fasting insulin, HOMA-IR, waist, and TG/HDL together and you have a remarkably complete picture of metabolic health for well under $100 of labs plus a tape measure.
Retesting Cadence and Tracking Trends
Once is never enough. A realistic cadence:
- Baseline: fasting insulin + fasting glucose + HbA1c + lipid panel + waist.
- During active intervention (new diet, fasting protocol, exercise change, medication): recheck at 8–12 weeks. Insulin responds to dietary and exercise changes within weeks, sometimes days — far faster than HbA1c, which lags 90 days.
- Stable phase once HOMA-IR is below target: every 6–12 months.
- Same lab every time if possible, to minimize assay drift.
Plot your numbers on a spreadsheet or phone note. HOMA-IR moves — often dramatically — with sustained changes in diet and activity. Watching your own number drop from 3.4 to 1.8 over six months is one of the most motivating experiences in preventive medicine.
Where the CGM Comes In
Fasting insulin and HOMA-IR are snapshots. A continuous glucose monitor is a movie. Together they answer different questions.
HOMA-IR tells you the baseline state of your pancreas-tissue relationship at rest. A CGM shows you how that system behaves in the wild — which specific foods spike you, how exercise blunts the spike, how sleep debt widens your daily glucose range, how stress hormones drive unexplained morning rises. The combination catches both the slow drift (trending HOMA-IR upward over years) and the daily insults (post-lunch 180 mg/dL spike every Tuesday) that drive the slow drift in the first place.
If budget forces a choice: do the fasting insulin first. It is cheaper, it is the better early-warning marker, and its result will tell you whether a CGM is worth pursuing. If HOMA-IR is below 1.5 and symptoms are mild, a CGM is optional. If HOMA-IR is above 2 or symptoms are loud, a two-week CGM trial will teach you more about your metabolism than any other single intervention. See CGM for Non-Diabetics for the companion article on wearing one intelligently.
Key Research Papers
Foundational publications validating HOMA-IR, QUICKI, the Matsuda Index, and the role of fasting hyperinsulinemia as the earliest detectable marker of insulin resistance. Each citation links to the full text via DOI.
- Matthews DR, Hosker JP, Rudenski AS, Naylor BA, Treacher DF, Turner RC. Homeostasis Model Assessment: Insulin Resistance and Beta-Cell Function from Fasting Plasma Glucose and Insulin Concentrations in Man (HOMA). Diabetologia. 1985;28(7):412–419.
- Wallace TM, Levy JC, Matthews DR. Use and Abuse of HOMA Modeling. Diabetes Care. 2004;27(6):1487–1495.
- Katz A, Nambi SS, Mather K, et al. Quantitative Insulin Sensitivity Check Index: A Simple, Accurate Method for Assessing Insulin Sensitivity in Humans. Journal of Clinical Endocrinology & Metabolism. 2000;85(7):2402–2410.
- Matsuda M, DeFronzo RA. Insulin Sensitivity Indices Obtained from Oral Glucose Tolerance Testing: Comparison with the Euglycemic Insulin Clamp. Diabetes Care. 1999;22(9):1462–1470.
- Reaven GM. Banting Lecture 1988. Role of Insulin Resistance in Human Disease. Diabetes. 1988;37(12):1595–1607.
- DeFronzo RA, Tobin JD, Andres R. Glucose Clamp Technique: A Method for Quantifying Insulin Secretion and Resistance. American Journal of Physiology. 1979;237(3):E214–E223.
- Stern SE, Williams K, Ferrannini E, DeFronzo RA, Bogardus C, Stern MP. Identification of Individuals with Insulin Resistance Using Routine Clinical Measurements. Diabetes. 2005;54(2):333–339.
- McLaughlin T, Reaven G, Abbasi F, et al. Is There a Simple Way to Identify Insulin-Resistant Individuals at Increased Risk of Cardiovascular Disease? American Journal of Cardiology. 2005;96(3):399–404.
- Petersen MC, Shulman GI. Mechanisms of Insulin Action and Insulin Resistance. Physiological Reviews. 2018;98(4):2133–2223.
- Saltiel AR, Olefsky JM. Inflammatory Mechanisms Linking Obesity and Metabolic Disease. Journal of Clinical Investigation. 2017;127(1):1–4.
- Knowler WC, Barrett-Connor E, Fowler SE, et al. Reduction in the Incidence of Type 2 Diabetes with Lifestyle Intervention or Metformin (Diabetes Prevention Program). New England Journal of Medicine. 2002;346(6):393–403.
Live PubMed Searches
Live PubMed queries that update as new papers are indexed.
- PubMed: HOMA-IR validation
- PubMed: fasting insulin as early marker
- PubMed: QUICKI and insulin sensitivity
- PubMed: Matsuda Index and OGTT
- PubMed: Kraft insulin patterns
- PubMed: triglyceride-to-HDL ratio
- PubMed: hyperinsulinemia and beta-cell compensation
- PubMed: postprandial IR and OGTT
Connections
- Blood Sugar & Insulin — interactive animation
- NAFLD & MASLD Connection
- Insulin Resistance
- Diabetes
- Metabolic Syndrome
- Metformin, Berberine and GLP-1s
- CGM for Non-Diabetics
- Insulin Resistance and PCOS
- Non-Alcoholic Fatty Liver Disease
- Polycystic Ovary Syndrome
- Exercise and Muscle Insulin Sensitivity
- Metabolic Syndrome Cardiovascular Risk
- Reversal Protocol: Diet and Fasting
- Fasting
- Fasting Insulin
- CGM
- Berberine
- GLP-1 Receptor Agonists
- Lipid Panel
- Insulin Resistance — the blood-sugar deep dive on what these numbers mean: Reaven's Syndrome X, ectopic liver fat, and the reversibility window.