A1c, Fructosamine, and Glycation Markers
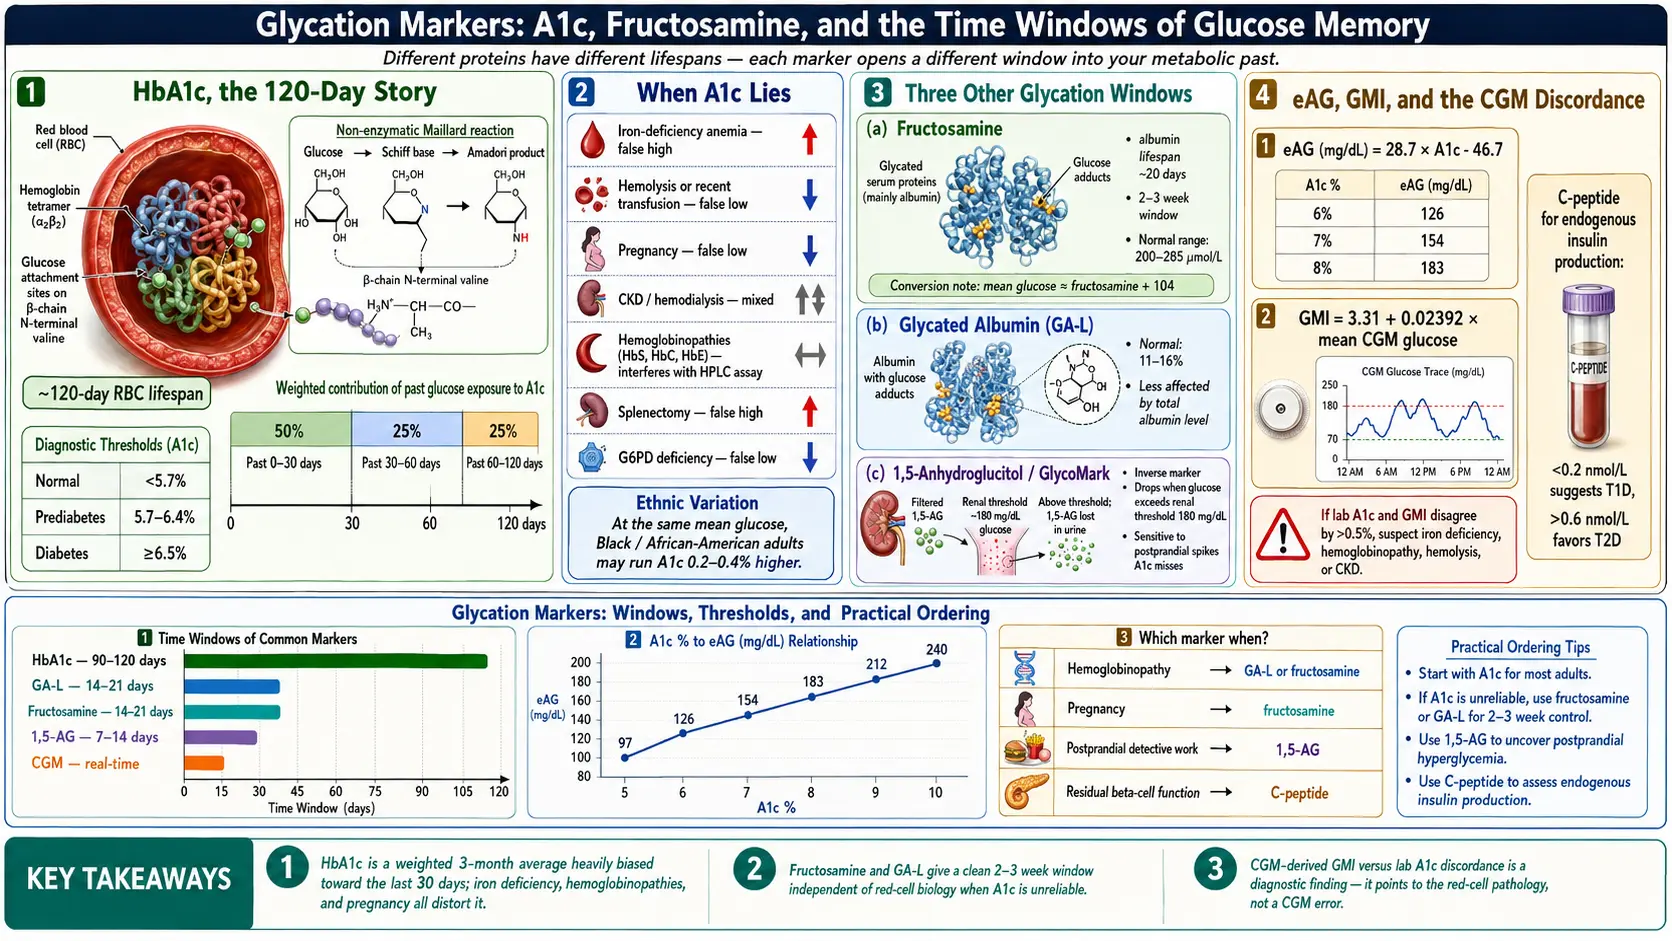
Table of Contents
- Why We Measure Glycation at All
- HbA1c — The 3-Month Average
- Diagnostic Thresholds and Treatment Targets
- A1c-to-eAG — Translating Percent to mg/dL
- NGSP and IFCC — Why Your A1c Is Comparable
- When A1c Lies
- Ethnic and Genetic Variation in A1c
- Fructosamine — The 2- to 3-Week Window
- Glycated Albumin (GA-L)
- 1,5-Anhydroglucitol (GlycoMark)
- GMI — The CGM-Derived A1c Estimate
- C-Peptide — Measuring Your Own Insulin
- Autoantibodies — Who Needs Them
- AGEs, RAGE, and Skin Autofluorescence
- Practical Ordering by Situation
- Key Research Papers
- Connections
- Featured Videos
Why We Measure Glycation at All
Sugar sticks to proteins. Not metaphorically — literally. When glucose circulates in the blood at elevated levels, it slowly and irreversibly attaches itself to the amino groups of proteins in a non-enzymatic reaction called glycation. The higher your average glucose, the more of your proteins carry these glucose tags. Glycation markers are simply measurements of how much sugar has stuck to specific proteins over specific time windows. Different proteins have different lifespans, so different markers open different windows into your metabolic past.
A fingerstick or fasting glucose value is a snapshot — a single frame. Glycation markers are time exposures. Each one averages your blood sugar over the life of the protein it sticks to: hemoglobin for three months, albumin for three weeks, and so on. Understanding which marker answers which question is one of the most useful skills a person with diabetes can develop.
HbA1c — The 3-Month Average
Hemoglobin A1c (HbA1c) is glycated hemoglobin. Hemoglobin lives inside red blood cells (RBCs), which circulate for approximately 120 days before the spleen removes them. While they circulate, the hemoglobin inside them picks up glucose molecules in proportion to ambient blood sugar. HbA1c is the fraction of hemoglobin carrying a glucose tag on the beta chain's N-terminal valine, reported as a percentage of total hemoglobin.
A 120-day average sounds uniform, but it isn't. Recent glucose matters more than old glucose because newer RBCs make up a larger share of the currently circulating pool and because glycation accumulates over time. In practice, roughly 50% of your A1c value reflects the last 30 days, about 25% reflects days 30–60, and the remaining 25% reflects days 60–120. That weighting is why an A1c drawn eight weeks after a serious treatment change already captures most of the benefit — you don't have to wait the full three months.
Diagnostic Thresholds and Treatment Targets
The American Diabetes Association (ADA) and the World Health Organization (WHO) converged on the same diagnostic A1c thresholds more than a decade ago:
- <5.7% — normal.
- 5.7–6.4% — prediabetes (increased risk).
- ≥6.5% — diabetes (confirmed on a repeat test unless unambiguous hyperglycemia is present).
Diagnosis is one question. Treatment targets are another, and they are individualized:
- <7.0% — the general adult target for most people with diabetes.
- <6.5% — reasonable for younger adults, those newly diagnosed, those with long life expectancy, and people planning pregnancy.
- <8.0% — acceptable for older adults, those with hypoglycemia unawareness, limited life expectancy, advanced complications, or when tighter control would be dangerous.
- Pregnancy — <6.0–6.5% if achievable without hypoglycemia. Pregnancy also shortens RBC turnover, which complicates interpretation (see below).
A target is a negotiation between the benefit of tighter control (fewer microvascular complications) and the cost of pushing too hard (hypoglycemia, weight gain, polypharmacy). If a clinician hands you a target without explaining it, ask why that number was chosen for you specifically.
A1c-to-eAG — Translating Percent to mg/dL
A1c is a percentage; fingersticks and CGMs report milligrams per deciliter. The estimated Average Glucose (eAG) equation, derived by Nathan and colleagues in 2008, converts between them:
eAG (mg/dL) = 28.7 × A1c − 46.7
A few reference points worth memorizing:
- A1c 5.0% → eAG ~97 mg/dL
- A1c 6.0% → eAG ~126 mg/dL
- A1c 6.5% → eAG ~140 mg/dL
- A1c 7.0% → eAG ~154 mg/dL
- A1c 8.0% → eAG ~183 mg/dL
- A1c 9.0% → eAG ~212 mg/dL
- A1c 10.0% → eAG ~240 mg/dL
The eAG is handy for translating lab reports into the units your meter speaks. It is not the same as your CGM's mean glucose — see the GMI section below for why those two numbers can disagree.
NGSP and IFCC — Why Your A1c Is Comparable
Before the early 2000s, A1c values from different labs were not directly comparable. Two global standardization programs fixed that:
- NGSP (National Glycohemoglobin Standardization Program) — reports A1c as a percentage (e.g., 7.0%) and anchors values to the DCCT reference method. This is the number you see on U.S. lab reports.
- IFCC (International Federation of Clinical Chemistry) — reports A1c in mmol/mol (e.g., 53 mmol/mol = 7.0% NGSP). Used in much of Europe and on some dual-unit reports.
Any modern A1c assay in the U.S., U.K., or EU is certified to one or both of these standards. If you see a point-of-care A1c from a non-certified device, ask whether it is NGSP-traceable before acting on it.
When A1c Lies
A1c assumes normal red blood cells living a normal 120-day life. When that assumption breaks, the number breaks with it. These are the conditions that falsely raise or lower A1c:
- Iron-deficiency anemia. Old RBCs stay in circulation longer than 120 days because the bone marrow cannot replace them fast enough. Hemoglobin has more time to accumulate glucose tags, so A1c reads falsely high. Treating the iron deficiency can drop A1c by 0.5–1.0% without any change in actual glucose.
- Recent blood loss, hemolysis, or hemolytic anemia. Young RBCs dominate, average hemoglobin age is lower, and A1c reads falsely low.
- Recent transfusion. You are now carrying someone else's glycated (or not-glycated) hemoglobin. Unreliable for at least 3–4 months.
- Hemoglobinopathies. HbS (sickle trait or disease), HbC, HbE, and beta-thalassemia with persistent HbF can interfere with certain A1c assay chemistries (especially some HPLC methods). Use an NGSP HbF-tolerant method or switch to fructosamine or glycated albumin.
- Pregnancy. Accelerated RBC turnover in the second and third trimesters lowers A1c by roughly 0.3–0.5%. Fructosamine or glycated albumin is preferred when fine-tuning glycemia near delivery.
- Chronic kidney disease and hemodialysis. Multiple competing effects: reduced erythropoiesis lengthens RBC life (raises A1c), but uremia, carbamylation of hemoglobin, and erythropoietin therapy shorten it (lower A1c). Net effect is unpredictable — interpret with caution and consider glycated albumin as an adjunct.
- Splenectomy. Without the spleen culling old RBCs, average RBC age rises and A1c reads falsely high.
- High altitude and chronic hypoxia. Higher hemoglobin turnover patterns and erythropoietin drive produce small upward shifts.
- Chronic liver disease and cirrhosis. Hypersplenism shortens RBC survival; A1c reads falsely low.
- G6PD deficiency. Oxidative hemolysis episodes shorten RBC life; A1c reads low during and after flares.
- Severe iron deficiency without anemia. Even before hemoglobin drops, iron deficiency appears to shift glycation kinetics upward.
- Erythropoietin or iron therapy. Young RBC cohorts flood in; A1c temporarily reads low.
If your self-monitored glucose and your A1c tell different stories, the first question to ask is not "which one is lying" but "which one is right for me." See the anemia page and chronic kidney disease for the conditions that most commonly distort A1c in practice.
Ethnic and Genetic Variation in A1c
Even in healthy people with identical mean glucose, A1c differs slightly by ancestry. A CDC analysis and subsequent multi-ethnic studies found that Black and African-American adults run A1c values approximately 0.2–0.4% higher than White adults at the same measured mean glucose. Smaller upward shifts have been reported in Hispanic and Asian populations. The mechanism probably involves differences in RBC lifespan, intracellular glucose transport, and glycation kinetics — not differences in diabetes control.
The practical implication is modest but real: a Black patient with an A1c of 6.6% may have the same average glucose as a White patient with an A1c of 6.3%. This does not change diagnostic thresholds — ADA guidelines use one A1c cutoff for everyone — but it is a reason to pair A1c with direct glucose measurements (fingersticks, CGM, fructosamine) whenever a diagnosis or target feels borderline.
Fructosamine — The 2- to 3-Week Window
Fructosamine measures all glycated serum proteins, which are mostly albumin with smaller contributions from globulins and lipoproteins. Albumin has a half-life of about 20 days, so fructosamine reflects your average glucose over roughly the past 2–3 weeks. It is cheap (often under $20 as a cash lab), widely available, and completely independent of hemoglobin — which is exactly what you want when A1c is unreliable.
Typical reference values (exact cutoffs vary by lab):
- 200–285 µmol/L — normal range in adults with normal albumin.
- >285 µmol/L — consistent with diabetes.
- A rough conversion: mean glucose (mg/dL) ≈ fructosamine (µmol/L) + 104. Use it cautiously — the relationship is less tight than A1c-to-eAG.
Because fructosamine scales with total serum protein, it needs an albumin correction when albumin is abnormal. A low-albumin state (nephrotic syndrome, cirrhosis, severe malnutrition) depresses fructosamine artificially, and a high-albumin state (dehydration) inflates it. Also affected:
- Thyroid disease. Hyperthyroidism speeds albumin turnover and lowers fructosamine; hypothyroidism does the opposite.
- Hyperbilirubinemia. Interferes with some colorimetric assays.
- High-dose vitamin C. Can reduce the nitroblue tetrazolium assay chemistry.
Fructosamine shines in three situations: pregnancy (when A1c is misleading and rapid adjustment matters), hemoglobinopathies (when A1c chemistry is compromised), and rapid treatment-change assessment (when you need to know in three weeks, not three months, whether a new insulin regimen is working).
Glycated Albumin (GA-L)
Glycated albumin (GA-L) is a refinement of the fructosamine idea. Instead of measuring all glycated serum proteins lumped together, GA-L measures only the glycated fraction of albumin and reports it as a percentage of total albumin (normal is roughly 11–16%). Because it is expressed as a ratio, it is less sensitive to the total albumin level and provides a more standardized window into the past 2–3 weeks.
GA-L is especially useful in hemodialysis patients (where A1c is notoriously unreliable and fructosamine is confounded by protein losses) and in pregnancy. It is more common in Japanese and Korean clinical practice than in the U.S., but U.S. reference labs now offer it. If your A1c is distrusted for any of the reasons in the When A1c Lies section, ask whether GA-L is available through your lab.
1,5-Anhydroglucitol (GlycoMark)
1,5-anhydroglucitol (1,5-AG), sold clinically as GlycoMark, is the odd marker out. It does not measure glycated anything. It measures a dietary sugar-alcohol normally present in blood at stable levels. When blood glucose exceeds the renal threshold of about 180 mg/dL, 1,5-AG competes with glucose for reabsorption in the kidney and is spilled into the urine. Serum 1,5-AG therefore drops when glucose spikes above 180. It is an inverse marker.
The window is short — roughly the past 1–2 weeks — and 1,5-AG is particularly sensitive to postprandial spikes that A1c smooths away. A patient whose A1c sits at 6.8% but whose CGM shows daily post-meal spikes to 240 mg/dL will often have a low 1,5-AG, flagging glycemic variability that the A1c is hiding.
1,5-AG is the answer to "my A1c looks fine but I feel terrible after meals." It is also useful for assessing whether a new prandial insulin strategy is flattening postprandial excursions. Reference ranges vary by kit; levels above roughly 10 µg/mL are typical in non-diabetic adults, and values that drop over time suggest worsening postprandial control.
GMI — The CGM-Derived A1c Estimate
The Glucose Management Indicator (GMI) is a CGM-derived estimate of what your A1c should be, given the mean glucose your sensor has measured over the reporting period. It replaced an earlier, less rigorous "estimated A1c" concept. The Beck 2018 formula is:
GMI (%) = 3.31 + 0.02392 × mean glucose (mg/dL)
Your CGM report shows GMI automatically. Here is where it gets useful: lab A1c and GMI frequently disagree by 0.3–0.5%, and sometimes by more than a full point. That gap is a diagnostic finding, not a flaw.
- Lab A1c higher than GMI by 0.5%+ — suspect iron deficiency, splenectomy, slower RBC turnover, or ethnic variation pushing A1c up.
- Lab A1c lower than GMI by 0.5%+ — suspect hemolysis, recent blood loss, hemoglobinopathy, pregnancy, liver disease, or erythropoietin therapy.
- Persistent mismatch with no obvious cause — ask for a hemoglobin electrophoresis. A silent HbS, HbC, or HbE trait is a common and often-missed explanation.
See the CGM and Time in Range article for how to use GMI alongside Time-in-Range and coefficient of variation to describe your glycemia in three dimensions instead of one.
C-Peptide — Measuring Your Own Insulin
Insulin is stored inside beta cells as proinsulin, a single chain that is cleaved into two fragments at the moment of release: insulin (the active hormone) and C-peptide (the connecting peptide). The two are secreted in equal molar amounts, but C-peptide has a much longer half-life and is not extracted by the liver, so it gives a more stable readout of endogenous insulin production. Crucially, C-peptide is not present in injected insulin — so it measures only what your own pancreas is still making, even in patients already on insulin therapy.
Common ways to order it:
- Random (non-fasting) C-peptide with a simultaneous glucose — the quickest screen. Interpret in the context of the glucose: a low C-peptide at glucose 50 mg/dL means little; a low C-peptide at glucose 250 mg/dL is meaningful.
- Fasting C-peptide + fasting glucose — standard pairing for evaluating residual beta-cell function.
- Stimulated C-peptide — measured 6 minutes after IV glucagon or 90 minutes after a mixed-meal tolerance test. The most sensitive way to detect preserved endogenous insulin.
Broad interpretation (units vary; nmol/L shown here, multiply by 3.0 for ng/mL):
- <0.2 nmol/L — consistent with type 1 diabetes; little to no endogenous insulin production.
- 0.2–0.6 nmol/L — indeterminate; consider latent autoimmune diabetes in adults (LADA), long-standing T2 with partial beta-cell failure, or early T1.
- >0.6 nmol/L — meaningful endogenous production; favors type 2 diabetes, MODY, or other non-autoimmune forms.
C-peptide is one of the single most clinically useful tests in diabetes and one of the most under-ordered. Every adult labeled "type 2" who is progressing rapidly, losing weight, or failing oral therapy deserves a C-peptide and autoantibody panel. See Types: T1, T2, LADA, MODY for the full differential.
Autoantibodies — Who Needs Them
Five antibodies define autoimmune (type 1 and LADA) diabetes:
- GAD65 — glutamic acid decarboxylase; the most common positive in adult-onset autoimmune diabetes (LADA).
- IA-2 (ICA512) — islet antigen 2; common in pediatric-onset T1.
- ZnT8 — zinc transporter 8; adds sensitivity when the others are negative.
- Insulin autoantibody (IAA) — only useful before exogenous insulin therapy begins; once you start injecting, all patients develop antibodies.
- ICA — islet cell antibodies by indirect immunofluorescence; an older broad-spectrum test.
The sibling article on diabetes types covers these antibodies in depth, including the thresholds, ordering strategy, and genetic testing that distinguishes MODY from LADA.
AGEs, RAGE, and Skin Autofluorescence
Advanced glycation end products (AGEs) are what glycated proteins and lipids eventually become if they are not cleared — stable, cross-linked molecules that accumulate in long-lived tissues like skin, cartilage, lens of the eye, and arterial wall. They signal through the receptor for AGEs (RAGE), which drives oxidative stress and inflammation, and they are mechanistically implicated in diabetic retinopathy, nephropathy, neuropathy, and cardiovascular disease.
In clinical research, AGEs are estimated non-invasively with a skin autofluorescence device (AGE Reader) that shines UV light on the forearm and measures tissue fluorescence proportional to skin AGE content. The technique is painless, takes under a minute, and correlates with long-term cumulative glycemic burden better than a single A1c. It is not yet standard clinical care in the U.S. — think of it as a biomarker of decades of glycemic exposure, potentially useful for cardiovascular risk stratification. Dietary AGEs (from high-heat cooking of meats and fats) contribute modestly; endogenous production from hyperglycemia contributes more.
Practical Ordering by Situation
Glycation markers are not a one-size-fits-all panel. Here is how to match the test to the question:
- New diagnosis of diabetes in any adult. Order A1c + C-peptide + GAD65 + IA-2 + ZnT8. The added marginal cost is small; the diagnostic clarity is enormous. Missing LADA in a "type 2" patient delays insulin by years and harms beta cells.
- Pregnancy. Use fructosamine or glycated albumin as your primary tracking marker, with frequent CGM/fingerstick data. Draw A1c once at confirmation and at the start of each trimester for context, but do not use it to titrate therapy near delivery.
- A1c disagrees with CGM/GMI by ≥0.5%. Order fructosamine as an independent check. If fructosamine agrees with the CGM, A1c is the outlier and you should hunt for why — CBC + iron studies + reticulocyte count + hemoglobin electrophoresis.
- Good A1c, bad symptoms. Fatigue after meals, weight regain, or neuropathy progressing despite "fine" labs? Add 1,5-AG (GlycoMark) to capture hidden postprandial spikes, and add fructosamine to corroborate.
- Hemodialysis or advanced CKD. De-emphasize A1c. Use glycated albumin plus CGM as the primary monitoring pair. See chronic kidney disease.
- Known hemoglobinopathy (HbS/C/E trait, thalassemia). Confirm your lab uses an NGSP-certified HbF-tolerant method, and prefer fructosamine or glycated albumin for routine monitoring.
- Rapid therapy change (new insulin regimen, GLP-1 start, bariatric surgery). Draw fructosamine at 3 weeks rather than waiting 3 months for A1c.
- Unexplained low A1c with symptoms of hyperglycemia. Consider hemolysis, hypersplenism, liver disease, or recent blood loss. CBC with reticulocytes is the first step. See anemia.
- Screening insulin resistance in a non-diabetic. A1c alone is insensitive. Pair it with fasting insulin and HOMA-IR for a metabolic picture years before A1c rises.
The goal is not to order every marker. The goal is to know which one to reach for when the default test stops telling the truth.
Key Research Papers
The following peer-reviewed papers anchor the science of HbA1c, fructosamine, glycated albumin, the Glucose Management Indicator (GMI), and advanced glycation end products discussed throughout this article.
- The Diabetes Control and Complications Trial Research Group. The Effect of Intensive Treatment of Diabetes on the Development and Progression of Long-Term Complications in Insulin-Dependent Diabetes Mellitus (DCCT). New England Journal of Medicine. 1993;329(14):977-986.
- UK Prospective Diabetes Study (UKPDS) Group. Intensive Blood-Glucose Control with Sulphonylureas or Insulin Compared with Conventional Treatment and Risk of Complications in Patients with Type 2 Diabetes (UKPDS 33). Lancet. 1998;352(9131):837-853.
- American Diabetes Association Professional Practice Committee. Standards of Care in Diabetes—2024. Diabetes Care. 2024;47(Suppl 1):S1-S321.
- Nathan DM, Kuenen J, Borg R, Zheng H, Schoenfeld D, Heine RJ. Translating the A1C Assay into Estimated Average Glucose Values (ADAG Study). Diabetes Care. 2008;31(8):1473-1478.
- Bergenstal RM, Beck RW, Close KL, et al. Glucose Management Indicator (GMI): A New Term for Estimating A1C from Continuous Glucose Monitoring. Diabetes Care. 2018;41(11):2275-2280.
- Selvin E, Steffes MW, Zhu H, et al. Glycated Hemoglobin, Diabetes, and Cardiovascular Risk in Nondiabetic Adults. New England Journal of Medicine. 2010;362(9):800-811.
- The International Expert Committee. International Expert Committee Report on the Role of the A1C Assay in the Diagnosis of Diabetes. Diabetes Care. 2009;32(7):1327-1334.
- Goldstein DE, Little RR, Lorenz RA, et al. Tests of Glycemia in Diabetes. Diabetes Care. 2004;27(7):1761-1773.
- Armbruster DA. Fructosamine: Structure, Analysis, and Clinical Usefulness. Clinical Chemistry. 1987;33(12):2153-2163.
- Singh R, Barden A, Mori T, Beilin L. Advanced Glycation End-Products: A Review. Diabetologia. 2001;44(2):129-146.
- Brownlee M. Biochemistry and Molecular Cell Biology of Diabetic Complications. Nature. 2001;414(6865):813-820.
- Vlassara H, Uribarri J. Advanced Glycation End Products (AGE) and Diabetes: Cause, Effect, or Both? Current Diabetes Reports. 2014;14(1):453.
- Cohen RM, Franco RS, Khera PK, et al. Red Cell Life Span Heterogeneity in Hematologically Normal People Is Sufficient to Alter HbA1c. Blood. 2008;112(10):4284-4291.
- Battelino T, Danne T, Bergenstal RM, et al. Clinical Targets for Continuous Glucose Monitoring Data Interpretation: Recommendations from the International Consensus on Time in Range. Diabetes Care. 2019;42(8):1593-1603.
Live PubMed Searches
Live PubMed queries that update as new papers are indexed.
- HbA1c standardization, NGSP, and IFCC
- HbA1c interference by hemoglobinopathies
- HbA1c and iron deficiency anemia
- HbA1c ethnic variation and African-American cohorts
- Fructosamine for diabetes monitoring
- Glycated albumin in hemodialysis
- 1,5-Anhydroglucitol and postprandial glucose excursions
- Glucose Management Indicator (GMI) from CGM
- C-peptide in LADA, type 1, and type 2
- GAD65, IA-2, and ZnT8 autoantibodies
- Advanced glycation end products and skin autofluorescence
- HbA1c in pregnancy and red cell turnover
Connections
- Glycation & HbA1c: What That Number Actually Measures — interactive animation
- Blood Sugar & Insulin — interactive animation
- Diabetes Overview
- Type 1 vs Type 2 vs LADA and MODY
- CGM and Time-in-Range
- Complications: Retinopathy, Nephropathy, Neuropathy
- Hypoglycemia Awareness and Prevention
- Insulin Types and Dosing Strategies
- Remission and Reversal Strategies
- Cardio-Renal Protection: SGLT2 and GLP-1
- Diabetic Foot Care and Ulcer Prevention
- Insulin Resistance
- Hemoglobin A1C Test
- Fasting Insulin and HOMA-IR
- Kidney Disease
- Anemia
- Iron Deficiency Anemia
- Metabolic Syndrome