Cormack & Hounsfield: The CT Scan, and What a Scan Can and Cannot Tell You
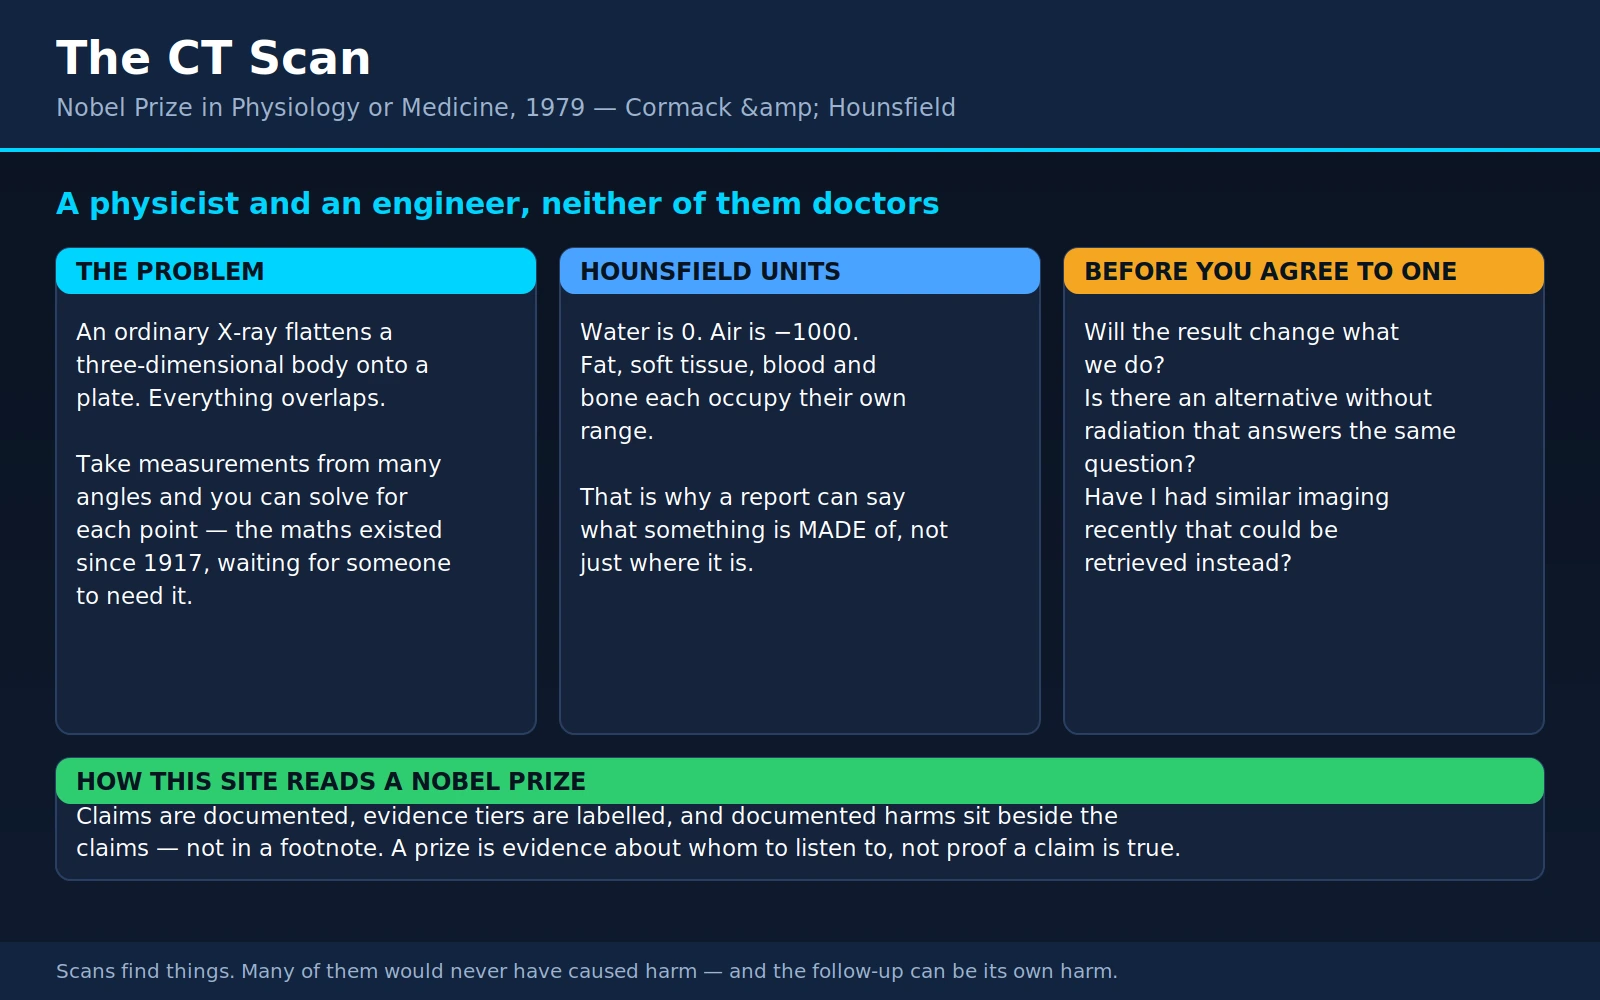
In 1979 the Nobel Prize in Physiology or Medicine went to two men who had never treated a patient, never attended a medical school, and never met each other until the technology they independently created was already changing hospitals around the world. Allan Cormack was a physicist. Godfrey Hounsfield was an electrical engineer. Between them they produced the computed tomography scanner — the CT scan, still called the "CAT scan" by many people — and with it the first practical way to look inside a living human body one slice at a time.
This page tells that story, and then does something the story usually does not get: it takes the resulting machine seriously as a thing that happens to you. A CT scan is a genuinely great medical technology. It is also a source of ionising radiation, a generator of alarming findings that turn out to be nothing, and a test that is sometimes ordered when a different test — or no test — would serve you better. All of those can be true at once, and a reader who understands all of them will have a better conversation with the doctor holding the requisition form.
Table of Contents
- The Prize and the Two Men
- The Problem with an X-Ray
- The Idea: Many Angles, One Slice
- 1971: The First Patient
- Hounsfield Units: Density as a Number
- What CT Is Genuinely Excellent For
- Radiation, Honestly
- Incidentalomas and Overdiagnosis
- Lung Cancer Screening: Where CT Saves Lives
- Questions Worth Asking Before a Scan
- CT Versus MRI
- Where Mainstream Medicine Agrees — and What Remains Debated
- Key Research Papers
- Connections
- Featured Videos
1. The Prize and the Two Men
The 1979 Nobel Prize in Physiology or Medicine was awarded jointly to Allan M. Cormack and Godfrey N. Hounsfield "for the development of computer assisted tomography." It was an unusual prize in at least three ways. Neither laureate was a physician. Neither had a doctorate in medicine or in anything else — Hounsfield's formal education ended with a diploma from an electrical engineering college. And the two halves of the work had been done independently, in different countries, roughly a decade apart, with the later half done in complete ignorance of the earlier.
Allan Cormack: the physicist who published into silence
Allan MacLeod Cormack (1924–1998) was born in Johannesburg, South Africa, to Scottish parents. He read physics at the University of Cape Town and went on to Cambridge as a research student in nuclear physics. Back in Cape Town as a lecturer, he was pulled sideways into medicine by an administrative accident: the local teaching hospital, Groote Schuur, needed a qualified physicist to supervise its use of radioactive isotopes, its own medical physicist had left, and Cormack was the nearest available person with the right credentials. He took the job part-time.
What he found there bothered him. Radiotherapy planning — deciding how much radiation would actually be delivered to a tumour deep in the body — was being done on the assumption that the body was a uniform block of tissue-equivalent material. It obviously was not. Bone, lung, fat and muscle absorb X-rays at very different rates, and a beam passing through a chest passes through all of them. To plan a treatment properly you would need a map of the absorption coefficient at every point inside the patient. No such map existed, and there was no obvious way to make one.
Cormack worked out how to make one. He moved to Tufts University in Massachusetts in 1957 and, in his own time, developed the mathematics for recovering a two-dimensional distribution from a set of line-integral measurements taken through it. He tested it experimentally on simple laboratory phantoms — aluminium and wood assemblies whose true composition he knew — and published the result in two papers in the Journal of Applied Physics, in 1963 and 1964.
Almost nobody read them. The papers appeared in a physics journal, not a medical one, and physicists had no use for a method for imaging the inside of a torso. Cormack later spoke wryly about the near-total absence of response; the anecdote he is most often quoted for is that the most memorable request for a reprint came not from a hospital but from an avalanche research centre in Switzerland, which had a snow-layer problem with the same mathematical shape. The story is repeated so often that we should note we have not been able to check it against Cormack's own Nobel autobiography directly — but the underlying fact is not in dispute, because Cormack himself described the reception of the papers as essentially nil, and the work sat unused for the better part of a decade.
There is an older layer to this still. The general mathematical problem — reconstruct a function from its integrals along all lines through its domain — had been solved in 1917 by the Austrian mathematician Johann Radon, in a paper on the determination of functions from their integral values along certain manifolds. Radon had no application in mind; he was doing pure mathematics, half a century before anyone had an X-ray tube and a computer to point at the problem. Cormack did not know of Radon's work when he did his own, and learned of it only afterwards. The transform that underlies every CT reconstruction in the world is named after a man who died in 1956, before the first scanner existed.
Godfrey Hounsfield: the engineer who built it
Godfrey Newbold Hounsfield (1919–2004) grew up on a farm in Nottinghamshire, England, taking machinery apart. He joined the Royal Air Force during the Second World War and worked on radar, ending up teaching it; radar is, in a sense, the ancestral discipline here, since it too is about inferring the shape of things you cannot see from the echoes they return. After the war he studied at Faraday House Electrical Engineering College in London and, in 1951, joined EMI — Electric and Musical Industries.
At EMI he worked first on radar and guided weapons, then on computers, leading the team that built the EMIDEC 1100, one of the first large all-transistor computers made in Britain. By the late 1960s he had moved to EMI's Central Research Laboratories, where he was given room to think about pattern recognition and, out of that, about a question that turned out to be Cormack's question in different words: how much can you infer about the contents of a closed box from measurements taken through it in many directions?
His first apparatus was a lathe bed with a radiation source at one end and a detector at the other, stepping and rotating around a specimen. It was agonisingly slow, and he improved it by switching from a weak gamma source to an X-ray tube. He worked out the reconstruction mathematics himself, from scratch, without knowing that Cormack had published a solution years earlier or that Radon had published a more general one in 1917. This is worth stating plainly rather than as a charming coincidence: the two halves of the 1979 prize were genuinely independent, and Hounsfield built a working machine on mathematics he had reinvented.
A word about EMI, the Beatles, and a story that is repeated too confidently
You will hear, often, that the CT scanner was paid for by the Beatles. EMI was the Beatles' record company, EMI was extremely profitable in the 1960s, and EMI's Central Research Laboratories were funded out of company money — so the sentence is not fabricated, and it is repeated by serious people. But it is a story about corporate accounting told fifty years after the fact, and it is usually stated with a confidence the evidence does not support. Development of the scanner also drew on support from the British Department of Health and Social Security, which bought early machines; EMI's research laboratories had many funding streams; and no line item anywhere reads "Sgt. Pepper → brain scanner." Treat it as the commonly-told version of events rather than as an audited fact. What is solidly true and more interesting is the underlying oddity: a consumer electronics and record company, with no medical division to speak of, built the first clinical CT scanner and for a few years dominated a market it had invented.
2. The Problem with an X-Ray
To understand why CT was revolutionary, you have to understand precisely what was wrong with the thing it replaced.
A conventional X-ray — a radiograph — is a shadow. X-rays are fired through the body onto a detector on the far side. Dense tissue absorbs more of them and leaves a brighter (whiter) region on the image; air absorbs almost none and leaves a dark region. That is genuinely useful information, and radiographs remain the right first test for a great many questions. But a radiograph has two limitations that no amount of technique can fix, because they are properties of the geometry rather than of the equipment.
Everything overlaps. A radiograph collapses a three-dimensional body onto a two-dimensional plate. Every structure the beam passed through contributes to the same point on the image, stacked on top of one another with no way to separate them. A lung nodule sitting behind a rib, or behind the heart, or behind the diaphragm, may be entirely invisible not because the image is poor but because something denser is in front of it. Radiologists develop remarkable skill at reading these superimpositions, and that skill has real limits.
Similar densities are indistinguishable. The contrast on a radiograph depends on differences in absorption. Bone against soft tissue is a large difference and shows beautifully. Air against soft tissue is a large difference, which is why chest radiographs are so informative. But grey matter against white matter, liver against spleen, tumour against the normal organ it grew in — these are small differences, and on a plain radiograph they are washed out entirely.
Put those two facts together and you get the situation that defined neurology and neurosurgery before 1971: the inside of the living brain was essentially unviewable. The skull is a dense box; the brain inside it is a nearly uniform soft tissue. A plain skull radiograph shows you the bone and tells you almost nothing about the contents. If a patient had headaches, seizures, weakness, or a personality change, and you needed to know whether there was a tumour, a bleed, or a mass of some other kind, you had no direct way to look.
What you had instead were indirect and invasive procedures. Cerebral angiography meant threading a catheter into an artery and injecting contrast to map the vessels, then inferring the presence of a mass from the way it pushed the vessels out of position. And there was pneumoencephalography, which deserves its reputation. The procedure involved performing a lumbar puncture, draining cerebrospinal fluid, and replacing it with air — then rotating and tilting the patient, often strapped into a chair built for the purpose, so the air bubble would migrate into the ventricles of the brain and outline them on radiographs. Air is far less dense than fluid, so the ventricles finally became visible, and their shape and displacement told you where a mass must be. It was, by every account written by anyone who witnessed or endured it, an ordeal: violent headache, vomiting, and days of recovery. Patients were sometimes given a general anaesthetic simply to get through it.
That is the technology CT replaced. Not a slightly worse scan — a procedure that hurt so much it was reserved for cases where the question could not be avoided. Within about a decade of Hounsfield's first patient, pneumoencephalography had essentially disappeared from medicine. That, more than any prize, is the measure of what happened in 1971.
3. The Idea: Many Angles, One Slice
The central idea of CT can be explained without a single equation, and it is worth explaining because it makes the whole machine intelligible.
Start with one X-ray beam, thin as a pencil, fired straight through the body along a single line and measured on the far side. What have you learned? You know how much the beam was weakened in total. You do not know where along the line the weakening happened. A beam that passed through a lot of muscle and no bone might be attenuated by the same amount as a beam that passed through a little bone and a lot of air. One measurement gives you a sum, not a distribution.
Now imagine that the slice of body you care about is divided into a grid of small squares, and each square has an unknown density value. Your single measurement told you the sum of the values in the squares that lie along that one line. Fire another beam parallel to the first but shifted slightly, and you get the sum along a neighbouring line. Sweep across the whole slice this way and you have a complete set of sums from one direction — what is called a projection. It is the shadow of the slice, viewed from that angle.
Then rotate. Take another complete set of sums from a different angle. Then another, and another, all the way around.
Here is the pivot the whole technology turns on. Any individual square in the grid lies on a great many of those lines — one from each angle. Each of those lines gives you an equation: the values in these particular squares add up to this particular number. With enough angles, you have far more equations than you have unknown squares, and the system can be solved. The individual density of every square in the grid falls out of the arithmetic. You have not photographed the inside of the body; you have computed it.
That is the entire principle, and it is why the word "computed" is in the name. It is also why CT could not have existed before it did. The mathematics was available from 1917. The X-ray tubes and detectors were available from much earlier. What was missing until the late 1960s was a computer capable of grinding through the reconstruction in anything less than an absurd length of time. CT is a case of a technology waiting decades for one of its three ingredients to arrive.
Two practical consequences follow from the principle, and both matter to a patient.
First, more angles means a better image and more radiation. Every projection is a set of real X-rays passing through a real person. The image quality you get is bought with dose. This is not a flaw to be engineered away; it is the fundamental trade of the technique, and it is why dose reduction is a genuine engineering discipline rather than a slogan.
Second, the output is numbers, not a picture. The grid of computed values is the actual result of a CT scan. The greyscale image on the screen is a rendering of those numbers chosen for human eyes, and a radiologist can re-render the same data with different brightness and contrast settings — "lung windows," "bone windows," "soft tissue windows" — to make different structures visible. When a radiologist "measures the density" of something on a scan, they are not estimating from the shade of grey. They are reading the number. Which brings us to the scale those numbers are expressed in.
4. 1971: The First Patient
The first clinical CT scan of a patient was performed on 1 October 1971, at Atkinson Morley's Hospital in Wimbledon, south London — a neurosurgical hospital, chosen because the neuroradiologist James Ambrose had taken Hounsfield's idea seriously when others had not. The patient was a woman with a suspected frontal lobe tumour.
The image that came back showed a dark, roughly circular lesion in the frontal lobe. Surgery confirmed it. For the first time, a physician had looked into the substance of a living human brain, seen a lesion, and been right about it — without a catheter, without draining anyone's cerebrospinal fluid, and without replacing it with air.
Hounsfield and Ambrose published the work in two consecutive papers in the British Journal of Radiology in 1973, in the same issue: Hounsfield describing the system, Ambrose describing the clinical application. Those two papers are the birth certificate of the field.
The machine that produced that first image was, by any modern standard, almost comically limited. It imaged the head only, with the patient's skull surrounded by a water bath to reduce the range of densities the detectors had to cope with. It produced an image on an 80 × 80 grid — 6,400 values for an entire cross-section of a human head. Acquisition took minutes per slice, and the reconstruction was a separate, off-line step: the raw data went onto magnetic tape and the tape went to a mainframe computer elsewhere, which chewed through the arithmetic and returned a picture some time later. Published accounts of the exact timings differ — you will see figures ranging from a few minutes to several hours for the reconstruction step, depending on which prototype and which computer is being described — so we will not put a single number on it. The honest summary is that the scan itself took minutes and the picture arrived considerably later, sometimes after a physical journey across London with a reel of tape.
Set that against a scanner in a hospital today. A modern multidetector CT reconstructs onto a 512 × 512 grid as standard — more than forty times as many values per slice — and produces not one slice but a stack of hundreds, thin enough to be reassembled into a three-dimensional volume that can be sliced again in any plane the radiologist wants. A CT of the chest, abdomen and pelvis is acquired in a single breath-hold, in seconds. Reconstruction is effectively instantaneous. A cardiac CT can freeze a beating heart between contractions.
Fifty-odd years separate an 80 × 80 picture of one head from a whole-body volume acquired faster than a patient can hold their breath. Almost none of the intervening improvement changed the principle Cormack wrote down in 1963. It changed the detectors, the tubes, the mechanical geometry, and above all the computers.
5. Hounsfield Units: Density as a Number
This is the part of the story a reader is most likely to meet in real life, printed on a radiology report, and it is worth understanding properly.
The numbers a CT scanner computes are expressed on a scale named after Hounsfield. The Hounsfield unit (HU), also called the CT number, is defined by fixing two reference points: water is 0 HU and air is −1000 HU. Everything else is placed on the scale relative to those two anchors, according to how strongly it attenuates X-rays compared with water.
Because the scale is anchored to physical materials rather than to the appearance of the image, a Hounsfield unit means the same thing on any properly calibrated scanner anywhere in the world. That is what makes it a measurement rather than an impression. Approximate characteristic ranges — and they are ranges, not exact values, varying with scanner settings, patient factors and whether intravenous contrast has been given — run roughly as follows:
- Air — −1000 HU by definition. Gas in the bowel, or free air where it should not be, sits down here.
- Lung — strongly negative, in the region of −500 to −900 HU, because normal lung is mostly air held in a fine tissue scaffold.
- Fat — modestly negative, around −50 to −100 HU. This is why fat is unambiguously identifiable on CT, and why a mass containing fat is usually a benign one.
- Water and simple fluid — 0 HU by definition, with simple cysts and cerebrospinal fluid sitting near it.
- Soft tissue and muscle — positive, roughly in the tens of HU. Brain grey and white matter differ by only a few units, which is exactly the difference a plain radiograph could never show and CT can.
- Acute blood — higher than surrounding brain, typically in the region of 50–80 HU when fresh, because clotting concentrates protein. This is the single most consequential number in emergency medicine, and section 6 explains why.
- Bone — strongly positive, with dense cortical bone at +1000 HU and above. Metal implants run off the top of the scale and cause streak artefacts.
Three practical points follow, and they are the reason this section exists.
A radiologist can often say what a structure is made of, not just where it is. This is the deepest difference between CT and a radiograph. If a report says a mass "measures 8 Hounsfield units," that is a statement that the contents behave like water — a simple cyst, in other words, and not a solid tumour. If it says a lesion "contains macroscopic fat," that is a strong pointer to a specific and usually benign set of diagnoses.
Some diagnostic thresholds are literally numbers. The best-known example is the adrenal gland. Small adrenal nodules are extremely common and almost always benign, and radiologists distinguish the benign ones using density directly: a nodule measuring at or below about 10 HU on an unenhanced scan is fat-rich enough to be characterised as a benign adenoma, and needs no further chasing. That single threshold, from a scale defined by an engineer at a record company, spares an enormous number of people a biopsy.
"Density" on a CT report is not a vague word. When a report describes something as "low density," "high density," or "isodense," it is describing measured attenuation relative to surrounding tissue. It is not the radiologist's impression of how something looked. If you are reading your own report and a density value is quoted, it is legitimate and useful to ask the doctor what that number means for the specific finding.
6. What CT Is Genuinely Excellent For
Before the honest discussion of costs, the honest statement of benefits. CT is not a marginal technology whose harms need weighing against a modest gain. In several situations it is decisively better than anything else available, and in some of them it is the difference between living and dying.
Major trauma. A patient arrives after a high-speed collision or a fall from height. They may be unconscious, they may have injuries in several body regions at once, and the clinical examination is unreliable in exactly the situation where it matters most. A CT covering head, spine, chest, abdomen and pelvis, acquired in seconds, answers questions about bleeding into the abdomen, blood around the lungs, injury to the aorta, fractures of the spine and pelvis, and bleeding inside the skull — simultaneously. No other test does this. Trauma care was reorganised around this capability.
Acute stroke — and this is the clearest single example on the page. A person arrives with sudden weakness on one side and slurred speech. Two very different things could be causing it. An ischaemic stroke is a clot blocking an artery, starving brain tissue of blood. A haemorrhagic stroke is a vessel that has burst and is bleeding into the brain. Clinically, at the bedside, they can look identical. The treatments are opposite: an ischaemic stroke may be treated with a clot-dissolving drug or by mechanically retrieving the clot, while giving a clot-dissolving drug to someone who is actively bleeding into their brain is catastrophic.
A non-contrast CT of the head, taking seconds, separates them. Fresh blood is denser than brain tissue — that 50–80 HU figure from the previous section — and shows up bright and obvious. This is why a stroke protocol runs the patient to a CT scanner immediately, and why "door-to-CT time" is a quality measure that hospitals are held to. The scan does not primarily exist to confirm the stroke; it exists to exclude haemorrhage so that treatment can safely begin. Our page on Stroke covers the condition itself.
Pulmonary embolism. A clot lodged in the arteries of the lung can kill quickly and presents with symptoms — breathlessness, chest pain, a fast heart rate — that overlap with a dozen harmless things. CT pulmonary angiography, in which iodinated contrast is injected and the scan timed to catch it filling the pulmonary arteries, shows the clot directly. It is the standard diagnostic test. See Pulmonary Embolism.
Kidney stones. Stones are dense, urine is not, and a non-contrast CT of the abdomen and pelvis finds them with very high accuracy, including the small ones and the ones made of materials that do not show on a plain radiograph. It shows their exact size and position, which determines whether a stone will pass on its own. Section 10 returns to this one, because it is also the best example on the page of a situation where a non-radiating alternative deserves consideration first. See Kidney Stones.
Appendicitis and the acute abdomen. Severe abdominal pain has a long differential diagnosis, several entries of which are surgical emergencies and several of which resolve on their own. CT distinguishes appendicitis, diverticulitis, bowel obstruction, perforation, and abscess, and it does so well enough that it has measurably reduced the rate of negative appendectomies — operations performed on a normal appendix.
Lung nodules and cancer staging. CT detects small lung nodules that a chest radiograph cannot see at all, and it maps the extent of a known cancer — local invasion, involved lymph nodes, spread to liver, adrenal glands or bone — which determines whether treatment is aimed at cure or control. Section 9 covers the screening use, which is a different question from the staging use.
Image-guided procedures. A radiologist can advance a needle into a lesion deep in the chest or abdomen under live CT guidance, taking a tissue sample without an operation, or place a drain into an abscess. This turns many diagnoses that once required surgery into an outpatient procedure with local anaesthetic.
Radiotherapy planning. There is a closed loop here worth noticing. Cormack's original motivation at Groote Schuur was that radiotherapy planning needed a density map of the patient, and no such map existed. Modern radiotherapy is planned on exactly that: a CT of the patient in treatment position, whose Hounsfield units are converted into the tissue densities the dose calculation requires. The problem that started the whole thing is now routinely solved by the thing it started. Cormack himself returned to the mathematics of rotation therapy dose distributions in papers published in the 1980s, long after the Nobel.
7. Radiation, Honestly
This is the section this page exists for, and it is the one where both the alarmist account and the dismissive account are common and both are wrong.
What is actually being measured
CT uses X-rays, which are ionising radiation: they carry enough energy to break chemical bonds, including bonds in DNA. Most such damage is repaired; some is not; unrepaired damage can, rarely, contribute to a cancer years or decades later. This is real physics and nobody disputes it.
Dose to a whole person is usually expressed as effective dose, in millisieverts (mSv), a quantity that weights the dose to each organ by that organ's radiosensitivity to give a single comparable number. It is a useful bookkeeping device with an important limitation we will come back to.
Two anchors give the numbers meaning. First, everyone is exposed to natural background radiation continuously — radon in indoor air, cosmic rays, radioactive potassium in your own body, radioactivity in soil and building materials — averaging on the order of a few millisieverts per year, with wide regional variation depending mostly on radon. Second, CT doses vary enormously by the body part scanned and by how the scan is done. A large study of over a thousand consecutive adult patients across four institutions found median effective doses ranging from about 2 mSv for a routine head CT to about 31 mSv for a multiphase abdomen and pelvis CT — a fifteen-fold spread between two things both called "a CT scan."
A plain chest radiograph, for comparison, delivers a small fraction of a millisievert. A CT of the chest delivers substantially more — enough that the comparison is properly made in multiples, not percentages. So the first honest statement is straightforward: a CT scan is a meaningfully larger radiation exposure than a plain X-ray, and it is not trivial.
The variation is the scandal, not the average
The same study found something more troubling than any single dose figure. Within each type of CT study, effective dose varied by a mean of thirteen-fold between the highest and lowest dose for that same study type, across and within institutions. Two people can have the identical examination, for the identical indication, and one receives an order of magnitude more radiation than the other — not because of anything about them, but because of how the scanner was set up.
That is a genuinely fixable problem, and it is the most actionable fact in this section. Dose reduction is a real engineering and protocol discipline: automatic tube current modulation, iterative and now deep-learning reconstruction algorithms that permit good images at lower dose, scanning only the region that answers the question, and not repeating phases that add nothing. Institutions that take dose seriously deliver much less radiation for the same diagnostic information.
What the risk estimates say, and where they come from
Now the harder part. How much cancer risk does a given dose cause?
The standard approach applies risk coefficients derived largely from long-term follow-up of survivors of the Hiroshima and Nagasaki atomic bombings, extrapolated downward to the much smaller doses involved in medical imaging using the linear no-threshold (LNT) model — the assumption that risk is proportional to dose all the way down, with no dose so small that it carries no risk at all.
Applying that model produces the widely-quoted figures. One analysis projected roughly 29,000 future cancers (95% uncertainty limits 15,000–45,000) attributable to the CT scans performed in the United States in a single year, 2007, with abdomen and pelvis scans the largest contributor. Another, from the same journal issue, estimated individual lifetime risks: about 1 in 270 women scanned by CT coronary angiography at age 40 would develop a cancer from that scan (about 1 in 600 men), compared with about 1 in 8,100 women having a routine head CT at 40 (about 1 in 11,080 men). Risks were roughly doubled for 20-year-olds and roughly halved for 60-year-olds, because cancer takes decades to appear and a younger person has more decades in which it can.
Read those numbers carefully, because their structure matters more than their magnitude. They are model outputs, not observations. Nobody counted 29,000 cancers. And even taken at face value, the individual figures describe a risk of roughly one in several hundred at the high end for a high-dose cardiac study in a young woman, and roughly one in ten thousand for a head CT — which is to say, small in both cases, and vanishingly small next to the risk of missing a brain haemorrhage.
The evidence in children, and the argument about it
Children are more radiosensitive than adults and have longer left to live, so paediatric imaging is where the question is sharpest. Two large cohort studies looked directly.
A British study followed patients first scanned before age 22 in NHS centres between 1985 and 2002. It found a positive dose-response association with both leukaemia and brain tumours. Cumulative doses of about 50 mGy roughly tripled leukaemia risk, and about 60 mGy roughly tripled brain tumour risk, compared with those receiving under 5 mGy. Crucially, the authors put the finding in absolute terms, and those are the terms that matter to a parent: in the ten years after a first scan in a child under 10, the estimate was about one excess case of leukaemia and one excess brain tumour per 10,000 head CT scans. An Australian data-linkage study of 680,000 exposed people found overall cancer incidence 24% higher in the exposed group, with an absolute excess incidence of about 9.4 cases per 100,000 person-years at risk.
These studies are frequently cited as settling the matter. They did not, and the reason is a specific and serious methodological objection called confounding by indication, or reverse causation. Children do not receive head CT scans at random. They receive them because a doctor was worried — sometimes about symptoms caused by a brain tumour that was already present and undiagnosed at the time of the scan. Some cancer-predisposing conditions also both cause more scanning and independently raise cancer risk. If you do not account for why the scan was ordered, you will attribute to the radiation some cancers that caused the scan rather than the reverse.
A French cohort of 67,274 children scanned before age 10 tested this directly by obtaining information on cancer-predisposing factors from discharge diagnoses — the information the earlier studies lacked. Around 32% of the cancers occurred in children with such predisposing factors, and adjusting for them reduced the excess risk estimates. In that cohort, no statistically significant excess risk in relation to CT exposure remained. The authors concluded that the indication for the examination must be taken into account to avoid overestimating the risk.
Note carefully what this does and does not show. The French study had a short mean follow-up (about four years) and small numbers of cancers, so it does not prove there is no risk — a null result in a small study rarely proves anything. It shows that the effect size in the earlier studies was probably inflated, and by how much is genuinely unresolved.
The argument about the model itself
There is a further and more fundamental dispute, and it is one where reasonable, credentialed scientists disagree in print.
A widely-read critique in Radiology argued that the projections of thousands of imaging-caused cancers are computed by multiplying small and highly speculative risk coefficients by very large patient populations, producing impressive-sounding totals from assumptions that do not bear the weight. Its specific objections were that the risk coefficients are taken from the BEIR VII report without the caveats that report itself attaches to their use; that the atomic-bomb survivor population differs greatly from patients undergoing imaging; that the International Commission on Radiological Protection explicitly warns against using effective dose for epidemiological studies or for estimating an individual's risk, which is precisely what these calculations do; and that extrapolating linearly from doses above 100 mSv down to a few millisieverts assumes an LNT relationship that substantial radiobiological data do not support at the low end. The authors further argued that the resulting media coverage causes real harm, when patients delay or refuse indicated imaging out of fear and are worse off for it.
Set against that, radiation protection bodies generally retain LNT as the basis for regulation, for a defensible reason: it is conservative, it is simple, and at doses this low the epidemiology genuinely cannot resolve whether the true risk is linear, threshold, or something else. LNT is best understood as a prudent regulatory assumption rather than a demonstrated biological fact at the doses involved in a single medical scan. Anyone who tells you flatly that a CT scan carries a precisely known cancer risk is overstating the evidence; so is anyone who tells you flatly that it carries none.
What to actually take away
Here is the summary we would defend:
- A single justified CT scan is worth it. The absolute risk from one indicated scan is small on any model anyone seriously proposes, and the diagnostic benefit of a scan that is genuinely needed is large and immediate. Nobody should refuse a stroke protocol head CT to avoid 2 mSv.
- Dose accumulates and repeated imaging is where attention belongs. The person to think hard about is not the one having a scan, but the one having their eighth. Chronic conditions that prompt repeated imaging are where the arithmetic starts to matter.
- Children warrant more caution — not avoidance, caution. Paediatric protocols exist and should be used.
- The unjustified scan is the one to worry about, because it delivers all of the dose and none of the benefit, and because it can start the cascade described in the next section.
8. Incidentalomas and Overdiagnosis
This is the cost of CT that gets discussed least and probably matters most, because it is far more common than radiation injury and it happens to people who felt fine.
An incidental finding — an "incidentaloma" — is something the scan discovers that has nothing to do with the reason the scan was ordered. You have a CT for abdominal pain and the appendix is normal, but there is a 1.2 cm nodule on your adrenal gland. You have a CT for a suspected pulmonary embolism and there is no clot, but there is a 6 mm nodule in the left lower lobe of the lung. You have a neck CT after a car accident and there is a nodule in your thyroid.
These are not rare. As multidetector CT has improved, the resolution has improved with it, and the finer the picture the more small things it finds. The American College of Radiology's white paper on the subject describes the problem precisely: incidental findings have become common, most are benign and clinically insignificant, and yet the inclination to investigate them is driven by an unwillingness — on the part of both doctors and patients — to accept uncertainty, even for a rare possibility of something important. The paper notes that evaluating and monitoring incidental findings is itself among the causes of rising imaging use, and that subjecting a patient to unnecessary testing and treatment can produce an injurious and expensive cascade.
The thyroid: the clearest illustration
A systematic review and meta-analysis of thyroid incidentalomas on CT gives unusually clean numbers, and they are worth walking through slowly because they show the whole mechanism in one place.
Across 38 studies and 195,959 patients, thyroid incidentalomas appeared on CT in 8.3% of people (95% CI 7.4–9.3) — higher on neck CT (16.5%) than on chest CT (6.6%). So roughly one in twelve people getting a CT that includes the neck acquires a thyroid finding they did not have a symptom of.
What happened next: 34.9% went on to a thyroid ultrasound, 28.4% to a biopsy, and 8.2% to surgery.
And what was actually there: the pooled risk of malignancy was 3.9% (95% CI 3.0–4.9). Size mattered a great deal — about 11.7% for nodules 1 cm or larger, against about 0.1% for those under 1 cm.
Sit with the comparison between 8.2% having surgery and 3.9% having a cancer, and the fact that nodules under 1 cm carried a malignancy risk of roughly one in a thousand. Some of those operations were necessary. Many were performed on people who were never going to be harmed by what was found. Every one of them carried the real risks of thyroid surgery — injury to the nerve that controls the voice, injury to the parathyroid glands, and for many, lifelong thyroid hormone replacement.
The broader lesson from thyroid cancer is well documented. A widely-cited analysis of South Korea's thyroid-cancer "epidemic" argued that a dramatic rise in diagnoses following widespread screening represented overdiagnosis — the detection of cancers that would never have caused symptoms or death — rather than a real rise in disease. Our page on Thyroid Cancer covers this in more depth.
The other classic sites
Adrenal glands. Small adrenal nodules are found on a substantial minority of abdominal CTs and are overwhelmingly benign adenomas. This is the incidentaloma with the happiest ending, because the Hounsfield unit threshold described in section 5 usually settles it without further testing: at or below about 10 HU unenhanced, it is a benign adenoma and the matter closes.
Kidneys. Renal cysts are extremely common and increase with age. Most are simple — uniform, water-density, thin-walled, non-enhancing — and require nothing. A structured classification exists to sort the simple from the ones that warrant follow-up, precisely so that "there is something on your kidney" does not automatically become a workup.
Lungs. Small pulmonary nodules are found constantly, particularly in anyone who has ever smoked. The Fleischner Society guidelines govern what to do about them, and their evolution is itself instructive: the 2017 revision raised the minimum size threshold for routine follow-up and replaced precise follow-up intervals with ranges, explicitly to give radiologists, clinicians and patients more discretion to weigh individual risk factors and preferences. The field has been correcting itself in the direction of doing less, on the basis of accumulated evidence about what these nodules actually turn out to be.
The honest framing
An incidental finding starts a cascade: a follow-up scan in three months, then another at a year, then perhaps a biopsy, then perhaps a procedure. Each step carries cost, some carry radiation, some carry procedural risk, and all of them carry something that does not appear in any of these studies — the experience of spending a year as a person with a thing on their kidney. That is a real harm, and treating it as merely psychological understates it, because anxiety changes behaviour, sleep, and the decisions people make about the rest of their care.
None of which is an argument against having an indicated scan. It is an argument for three things: that the scan should be indicated in the first place; that "we found something small, and the evidence says the right thing to do is nothing" is a legitimate and often correct medical answer; and that a patient is entitled to ask, when a follow-up is proposed, what the realistic probability is that this finding is important and what would change if it were.
9. Lung Cancer Screening: Where CT Saves Lives
Having spent two sections on the costs of imaging, honesty requires an equally clear account of the place where CT screening has one of the strongest positive results in modern preventive medicine.
Screening means scanning people with no symptoms in the hope of catching disease early. It is much harder to make work than it sounds, and the history of cancer screening is full of tests that found more cancer without saving more lives. Chest radiography was tried for lung cancer screening and failed. Low-dose CT succeeded, and two large randomised trials show it.
The National Lung Screening Trial
The NLST enrolled 53,454 people at high risk of lung cancer at 33 US medical centres, randomising them to three annual screens with either low-dose CT or a single-view chest radiograph. Adherence exceeded 90%.
The result: lung-cancer deaths ran at 247 per 100,000 person-years in the CT group against 309 in the radiography group — a 20.0% relative reduction in lung-cancer mortality (95% CI 6.8–26.7; P=0.004). Death from any cause was also reduced, by 6.7% (95% CI 1.2–13.6; P=0.02). That second figure is the one to weight most heavily, because all-cause mortality cannot be gamed by reclassifying causes of death, and very few cancer screening trials have ever moved it.
Now the honest other half, from the same paper. The rate of positive screening tests was 24.2% with low-dose CT. And 96.4% of those positive results were false positives. Roughly one in four screened people got called back about something, and roughly 24 in every 25 of those had nothing. Most false positives were resolved with further imaging rather than surgery, but "resolved with further imaging" still means months of waiting and worrying, plus additional scans.
The NELSON trial
The Dutch-Belgian NELSON trial tested a different design: 13,195 men aged 50 to 74 in the primary analysis, randomised to volume-based CT screening at baseline, year 1, year 3 and year 5.5, or to no screening at all — a stronger comparison than NLST's chest radiograph. Follow-up ran a minimum of ten years.
At ten years the cumulative rate ratio for death from lung cancer was 0.76 (95% CI 0.61–0.94; P=0.01) in the screened men: about a 24% reduction, independently confirming NLST in a different population against a no-screening control.
NELSON's other contribution was to show the false-positive problem is partly solvable by protocol. By using nodule volume and growth rate rather than diameter to decide what counted as suspicious, and by using a short-interval repeat scan for indeterminate results, the trial got its referral rate for suspicious nodules down to 2.1%, with 9.2% of participants having at least one additional CT for an initially indeterminate finding. Against NLST's 24.2% positive rate, that is a very large improvement in the harm side of the ledger for a comparable benefit.
One result must be reported precisely, because it is the kind of thing that gets misquoted. Among the 2,594 women in NELSON the rate ratio was 0.67 (95% CI 0.38–1.14). The point estimate is favourable and larger than the men's. But the confidence interval crosses 1.0, and this was a subgroup analysis in a trial powered for men. It is not a demonstration of benefit in women; it is a suggestive result in too few people. The evidence that screening helps women rests principally on NLST, which enrolled both sexes.
Who this applies to
The benefit is confined to people at high risk, because screening a low-risk population would generate the same false positives with almost none of the cancers. The US Preventive Services Task Force recommends annual low-dose CT screening for adults aged 50 to 80 who have a 20 pack-year smoking history and either currently smoke or quit within the past 15 years, a B-grade recommendation. This 2021 statement widened the 2013 criteria, which had required age 55 and 30 pack-years — a change that brought in more people, and in particular improved eligibility for groups whose lung cancer risk was high at lower cumulative smoking exposure.
If you meet those criteria, this is one of the clearest cases in medicine for asking your doctor about a scan rather than waiting to be offered one. If you do not, low-dose CT screening is not recommended, and whole-body "executive" CT screening in healthy people is recommended by nobody — it is section 8's cascade, purchased deliberately. Our page on Lung Cancer covers the disease itself.
10. Questions Worth Asking Before a Scan
These are not challenges, and they are not a script for refusing imaging. Radiologists and the professional bodies that represent them have been pushing these questions harder than patients have, for years. Asking them is informed participation, and a good clinician will welcome it.
"Is this scan going to change what we do?"
This is the single most useful question, because it cuts to the point of any test. A test is worth doing when its plausible results would lead to different actions. If the answer is "we would treat you the same either way," the scan is providing reassurance rather than information — which is sometimes a legitimate goal, but it should be named as such and chosen deliberately, not slipped in as though it were diagnostic necessity. A good doctor usually has a crisp answer to this, and if the answer is vague, that is itself informative.
"Is there a test without radiation that answers the same question?"
Sometimes yes, and the best-documented example is kidney stones. A large pragmatic randomised trial assigned 2,759 emergency department patients with suspected kidney stones to initial point-of-care ultrasound, initial radiology ultrasound, or initial CT. The rate of high-risk diagnoses with complications in the first 30 days was low (0.4%) and did not differ by imaging method. There were no significant differences in serious adverse events, pain scores, return emergency visits, hospitalisations, or diagnostic accuracy. Cumulative radiation exposure over six months was significantly lower in the ultrasound groups.
The honest caveat, from the trial's own design: subsequent management, including additional imaging, was left to the treating physician, and many ultrasound-first patients went on to have a CT anyway. So the finding is not "ultrasound replaces CT." It is that ultrasound first is a safe starting point that spares radiation in the substantial fraction of patients for whom it settles the question. That is a real and useful result, and it generalises as a principle: ultrasound for gallbladder, many gynaecological and obstetric questions, and much of paediatric abdominal imaging; MRI for brain detail, spinal cord, joints, and soft-tissue characterisation.
Sometimes the answer is no, and it should be accepted cleanly. There is no non-radiating substitute for a head CT in acute stroke, or for CT in major trauma, that is fast enough to be useful.
"Have I had similar imaging recently that could be retrieved?"
Repeat imaging because a prior study was done at a different hospital and nobody chased it is a common, avoidable source of dose. Records are more portable than they used to be, and radiology departments can usually import outside studies from a disc or an image exchange network. It is worth telling a doctor unprompted: I had a CT of my abdomen at another hospital in March. Beyond sparing a scan, a prior study is diagnostically valuable in its own right, because a nodule that has not changed in two years means something quite different from a new one. Keeping a simple personal list of your imaging — date, body part, where — is genuinely useful.
For children: "Is a paediatric protocol being used?"
Children are not small adults for imaging purposes: they are more radiosensitive, and a dose setting appropriate for a 90 kg adult is far more than a child needs for a diagnostic image. Paediatric protocols — "child-sizing" the technique — are standard practice at children's hospitals and at most general hospitals, but asking costs nothing and signals that the family is paying attention. It is also fair to ask whether an ultrasound or MRI would answer the question, since paediatric practice has shifted substantially toward both.
Two further practical points
Contrast. Many CT scans are done with intravenous iodinated contrast, which sharply improves the visibility of blood vessels, organs and many tumours. Tell the team about previous reactions to contrast, significant kidney disease, and any thyroid condition. Ask whether contrast is needed for your question — for kidney stones, for example, the standard study is deliberately non-contrast.
Get the result explained, not just released. Radiology reports are written by one doctor for another and are dense with hedged language. "Cannot exclude," "clinical correlation recommended," and "of uncertain significance" mean specific things in that dialect and read as far more ominous than they are to a patient encountering them cold in an online portal. If a report contains a finding, ask the ordering doctor what it means, what the realistic probability is that it matters, and what — if anything — happens next.
11. CT Versus MRI
Readers ask this constantly, often having been told they need one when they expected the other. They are different physics answering different questions, and neither is the better machine in general.
How they differ physically
CT measures how much X-ray energy tissue absorbs. It maps density. It is fast — a body scan in seconds — and it uses ionising radiation.
MRI places the body in a strong magnetic field and uses radio waves to disturb and then listen to hydrogen nuclei, mostly in water and fat. It maps the chemical environment of those nuclei, which is why it distinguishes soft tissues that are almost identical in density. It is slow — typically twenty minutes to an hour — extremely loud, and enclosed. It uses no ionising radiation at all.
What each is better at
CT wins for: speed above all, which makes it the test for anyone unstable or uncooperative; bone and fractures; acute bleeding anywhere, especially in the head; the lungs, where MRI performs poorly because air gives little signal; calcium, including kidney stones and coronary artery calcium, which is the basis of the Coronary Calcium Score; and availability, since CT scanners are more numerous, cheaper to run, and staffed around the clock in more hospitals.
MRI wins for: brain and spinal cord detail, including the small ischaemic strokes CT misses in the early hours, multiple sclerosis plaques and subtle tumours; joints, ligaments, cartilage, tendons and bone marrow; characterising soft-tissue and liver lesions; pelvic organs; and any situation where imaging must be repeated many times over years, since there is no accumulating radiation dose.
Safety differences that are not about radiation
MRI's lack of radiation does not make it risk-free, and its risks are of an entirely different kind. The magnet is always on. Ferromagnetic objects become projectiles. Certain implants are contraindications or require specific conditions and settings: some older pacemakers and defibrillators, cochlear implants, some aneurysm clips, some neurostimulators, and metallic foreign bodies in the eye, which is why people with a history of metalworking are asked about it. The screening questionnaire before an MRI is a genuine safety procedure. MRI is also difficult or impossible for people with significant claustrophobia without sedation, and it demands stillness for long periods, which is why young children often need general anaesthesia for an MRI but not for a CT — a real risk that belongs in the comparison.
The contrast agents are different substances with different risks
This is frequently confused, and the distinction matters.
CT contrast is iodine-based, given intravenously. Its principal concerns are allergic-type reactions, ranging from mild flushing and hives to rare severe anaphylactoid reactions, and possible effects on kidney function. The kidney question has been substantially revised in recent years: the risk of contrast-induced kidney injury from modern agents was for a long time overestimated, because studies comparing patients who received contrast with those who did not failed to account for the fact that sicker patients get more scans. Current practice is considerably less restrictive than it was, though caution remains for people with significantly impaired kidney function.
MRI contrast is gadolinium-based — a completely different element, with a completely different risk profile. An iodine allergy is not a reason to avoid gadolinium, and vice versa. Gadolinium's specific historical concern is nephrogenic systemic fibrosis, a rare and serious fibrosing condition in people with severe kidney impairment; it has become very rare with newer agent classes and routine screening of kidney function. A more recent question is that traces of gadolinium can be retained in body tissues, including the brain, after repeated administration; no harm from this has been demonstrated, and it remains an area of active investigation rather than a known danger.
And ultrasound, which belongs in the comparison
Ultrasound uses sound waves: no radiation, inexpensive, portable, real-time, and safe in pregnancy. It is excellent for the gallbladder, kidneys, thyroid, blood vessels, many gynaecological and obstetric questions, and the heart. It is limited by air and by bone, which reflect sound — so it cannot see through the lungs or into the skull in adults — and it is more operator-dependent than either CT or MRI. When ultrasound can answer the question, it is very often the right first test.
12. Where Mainstream Medicine Agrees — and What Remains Debated
Where there is broad agreement
- CT is one of the most valuable diagnostic technologies ever developed, and in trauma, acute stroke, pulmonary embolism, and the acute abdomen it is decisively the right test.
- CT uses ionising radiation and doses are not trivial, ranging from a few millisieverts for a head CT to tens for multiphase abdominal studies.
- The benefit of a properly indicated scan outweighs its radiation risk, on any risk model currently in serious contention.
- Dose should be minimised for a given diagnostic purpose, and the thirteen-fold variation observed for identical study types is a quality problem, not an inevitability.
- Children require dose-adapted protocols, and non-radiating alternatives should be preferred in paediatrics where they answer the question.
- Incidental findings are common and mostly benign, and structured guidelines for managing them exist precisely to prevent unnecessary cascades.
- Low-dose CT screening reduces lung cancer mortality in high-risk smokers and former smokers, demonstrated by two independent randomised trials.
- Whole-body CT screening of asymptomatic healthy people is not recommended by any major professional body.
What remains genuinely debated
- Whether the linear no-threshold model is correct at low doses. This is the deepest disagreement. LNT is retained as a conservative regulatory basis; substantial published criticism holds that it overstates risk at the millisievert scale and that population-level cancer projections built on it are not scientifically defensible. The epidemiology at these doses cannot currently settle it, and honest sources say so.
- How much of the observed paediatric CT–cancer association is causal. The British and Australian cohorts found dose-response relationships; the French cohort, which had data on cancer-predisposing conditions, found that adjusting for indication substantially reduced the estimates. The true effect size is unresolved.
- How aggressively to pursue incidental findings. Thresholds for follow-up have generally been loosening as evidence accumulates that small lesions are usually nothing, but the balance between missing an early cancer and generating cascades of investigation is argued case by case and specialty by specialty.
- Lung cancer screening eligibility. Age and pack-year thresholds are periodically revised; whether risk-prediction models should replace simple criteria, whether people who quit more than 15 years ago should be included, and how to reach the eligible people who are not being screened are all open questions.
- How much imaging is too much overall. CT use rose steeply from 2000 and, while growth has slowed in more recent years, whether the imaging performed is appropriate or improves outcomes is, in the words of one large analysis of utilisation trends, unknown.
- The clinical significance of gadolinium retention after repeated MRI contrast, which is documented but of undemonstrated consequence.
13. Key Research Papers
Every citation below was checked against PubMed or Crossref for journal, year, volume and pages before being listed. Where a paper is not indexed in PubMed, that is stated explicitly and the DOI is given instead — the two foundational Cormack papers are in this category, being physics papers from a physics journal, which is precisely why medicine did not notice them for a decade.
- Cormack AM. Representation of a Function by Its Line Integrals, with Some Radiological Applications. J Appl Phys 1963;34(9):2722-2727 — verified via Crossref; not indexed in PubMed. The mathematical foundation, published in a physics journal to near-total silence.
- Cormack AM. Representation of a Function by Its Line Integrals, with Some Radiological Applications. II. J Appl Phys 1964;35(10):2908-2913 — verified via Crossref; not indexed in PubMed. The follow-up, including experimental tests on phantoms.
- Hounsfield GN. Computerized transverse axial scanning (tomography). 1. Description of system. Br J Radiol 1973;46(552):1016-22 — the original description of the working scanner. Note that a "classic republication" of this paper appeared in the same journal in 1995; the article of record is the 1973 original cited here.
- Ambrose J. Computerized transverse axial scanning (tomography). 2. Clinical application. Br J Radiol 1973;46(552):1023-47 — the companion paper in the same issue, by the neuroradiologist who ran the first clinical scans.
- Hounsfield GN. Computed medical imaging. Nobel lecture, December 8, 1979. J Comput Assist Tomogr 1980;4(5):665-74 — Hounsfield's own account. Cormack's Nobel lecture appears immediately before it in the same issue, at pages 658-64.
- Brenner DJ, Hall EJ. Computed tomography — an increasing source of radiation exposure. N Engl J Med 2007;357(22):2277-84 — the review that put CT dose on the agenda of general medicine. A narrative review without a structured abstract; we cite it for its framing rather than for specific figures.
- Smith-Bindman R, Lipson J, Marcus R, et al. Radiation dose associated with common computed tomography examinations and the associated lifetime attributable risk of cancer. Arch Intern Med 2009;169(22):2078-86 — source of the 2 mSv to 31 mSv range and of the thirteen-fold within-study-type dose variation.
- Berrington de González A, Mahesh M, Kim KP, et al. Projected cancer risks from computed tomographic scans performed in the United States in 2007. Arch Intern Med 2009;169(22):2071-7 — the 29,000 projected cancers figure. A Monte Carlo modelling study, not an observation.
- Pearce MS, Salotti JA, Little MP, et al. Radiation exposure from CT scans in childhood and subsequent risk of leukaemia and brain tumours: a retrospective cohort study. Lancet 2012;380(9840):499-505 — source of the absolute estimate of roughly one excess leukaemia and one excess brain tumour per 10,000 paediatric head CTs.
- Journy N, Rehel JL, Ducou Le Pointe H, et al. Are the studies on cancer risk from CT scans biased by indication? Elements of answer from a large-scale cohort study in France. Br J Cancer 2015;112(1):185-93 — the confounding-by-indication critique, tested with data on cancer-predisposing factors.
- Hendee WR, O'Connor MK. Radiation risks of medical imaging: separating fact from fantasy. Radiology 2012;264(2):312-21 — the sustained argument against applying LNT-derived coefficients to imaging populations. Read alongside items 8 and 9, not instead of them.
- The National Lung Screening Trial Research Team. Reduced lung-cancer mortality with low-dose computed tomographic screening. N Engl J Med 2011;365(5):395-409 — the 20.0% lung-cancer mortality reduction, and the 96.4% false-positive rate among positive screens.
- de Koning HJ, van der Aalst CM, de Jong PA, et al. Reduced lung-cancer mortality with volume CT screening in a randomized trial. N Engl J Med 2020;382(6):503-513 — the NELSON trial: rate ratio 0.76 in men against a no-screening control, with a 2.1% referral rate. The women's subgroup result was not statistically significant.
- Berland LL, Silverman SG, Gore RM, et al. Managing incidental findings on abdominal CT: white paper of the ACR Incidental Findings Committee. J Am Coll Radiol 2010;7(10):754-73 — the consensus framework for kidney, liver, adrenal and pancreatic incidentalomas, and a candid account of why the cascade happens.
- Song Z, Wu C, Kasmirski J, et al. Incidental thyroid nodules on computed tomography: a systematic review and meta-analysis examining prevalence, follow-up, and risk of malignancy. Thyroid 2024;34(11):1389-1400 — 195,959 patients: 8.3% prevalence, 8.2% proceeding to surgery, 3.9% pooled risk of malignancy.
Four further papers are cited inline in the sections above and are listed here for completeness, each verified the same way: MacMahon H, et al. Guidelines for management of incidental pulmonary nodules detected on CT images: from the Fleischner Society 2017 (Radiology 2017;284(1):228-243); Mathews JD, et al. Cancer risk in 680,000 people exposed to computed tomography scans in childhood or adolescence (BMJ 2013;346:f2360); Smith-Bindman R, et al. Ultrasonography versus computed tomography for suspected nephrolithiasis (N Engl J Med 2014;371(12):1100-10); and US Preventive Services Task Force. Screening for lung cancer: USPSTF recommendation statement (JAMA 2021;325(10):962-970). The South Korean thyroid overdiagnosis commentary referenced in section 8 is Ahn HS, Kim HJ, Welch HG (N Engl J Med 2014;371(19):1765-7), and the imaging utilisation figures in section 12 are from Smith-Bindman R, et al. (JAMA 2019;322(9):843-856).
Live PubMed Searches
- Computed tomography history and development
- CT radiation dose and cancer risk
- Low-dose CT lung cancer screening
- Incidental findings: imaging management
- CT versus MRI indications
Connections
- All Notable Doctors
- Nobel Prize in Physiology or Medicine — the complete roll of laureates, 1901 to the present
- Willem Einthoven — the other measurement-device prize: the string galvanometer and the electrocardiogram, another machine that turned a bodily process into a readable trace
- Rosalyn Yalow — radioimmunoassay, and the same underlying lesson as this page: measurement is what makes diagnosis possible, and a physicist can supply it
- Otto Warburg — the metabolic biology of tumour cells, which is the basis of the PET scan that is now routinely fused with CT
- Forssmann, Cournand & Richards — cardiac catheterisation: the invasive way of seeing inside, and the tradition CT began to displace
- Hartwell, Hunt & Nurse — the cell cycle, and why radiation damage to DNA matters more in dividing tissue and in the young
- Coronary Calcium Score — a CT-based test built directly on the density scale described in section 5
- Oncology — cancer diagnosis, staging and treatment, where CT does much of the work
- Cardiology — cardiac CT, coronary calcium, and the imaging of the heart
- Lung Cancer — the disease behind section 9's screening trials
- Stroke — where a non-contrast head CT decides whether clot-busting treatment is safe
- Kidney Stones — CT's greatest strength and the clearest case for trying ultrasound first
- Pulmonary Embolism — diagnosed by CT pulmonary angiography
- Thyroid Cancer — the overdiagnosis story that section 8's incidentaloma numbers point to