Willem Einthoven: The Electrocardiogram, and How to Read Your Own Heart Tracing
Almost everyone reading this has had an electrocardiogram, or will. It is one of the most-performed tests in medicine: a few electrodes, ten seconds of recording, a strip of paper with a jagged line on it, and a one-line verdict printed across the top. Almost nobody is ever taught what that jagged line is, what it is capable of showing, or — the part that matters most — what it is not capable of showing. This page is about the man who invented it, and about how to be a more competent reader of your own tracing.
Table of Contents
- The Prize and the Man
- The Problem: A Signal Nobody Could Hold Still
- The String Galvanometer, 1901
- The Letters P, Q, R, S and T
- Einthoven's Triangle and the Leads
- Telecardiograms: Remote Monitoring in 1905
- What an ECG Can and Cannot Tell You
- Reading Your Own Tracing
- Wearables and Consumer ECG
- Atrial Fibrillation, Since That Is What Watches Find
- Where Mainstream Medicine Agrees — and What Remains Debated
- Key Research Papers
- Connections
- Featured Videos
1. The Prize and the Man
Willem Einthoven (1860–1927) received the Nobel Prize in Physiology or Medicine for 1924, awarded — in the Karolinska Institute's phrasing — for the discovery of the mechanism of the electrocardiogram. It was an unshared prize. He travelled to Stockholm to deliver his Nobel lecture in December 1925, the year after the award, and he died in Leiden in September 1927, at 67.
He was born on 21 May 1860 in Semarang, on the north coast of Java, then part of the Dutch East Indies. His father was a physician to the colonial military administration and died when Willem was a young boy; his mother brought the family back to the Netherlands, to Utrecht, in 1870. Einthoven studied medicine at the University of Utrecht and finished a doctorate in 1885, but he was never really a bedside physician. His instincts ran the other way — toward optics, mechanics, precision measurement, and the specific and unglamorous problem of building an instrument that does not lie.
In 1886, at twenty-six, he was appointed professor of physiology at the University of Leiden, a chair he held for the next forty-one years. That is the whole external biography: one city, one job, one long argument with the limits of measurement. What makes Einthoven interesting is not a flash of insight but a temperament. He was the sort of scientist who, when the recording apparatus distorted the signal, did not shrug and interpret the distortion — he first worked out mathematically what the true curve must have been, and then, dissatisfied with a correction, built a machine that did not need one.
There is a small historical footnote worth keeping: the 1924 prize honoured Einthoven for the instrument and the mechanism, but the person who did the most to turn the electrocardiogram into a working clinical language was the British cardiologist Thomas Lewis, who used Einthoven's machine to describe arrhythmias in patients and who Einthoven himself credited generously. Lewis never received a Nobel Prize. Historians have picked over the nomination record since; it is one of the standing examples of how a prize awarded to an instrument-maker can leave the clinician who made it useful in the shade.
2. The Problem: A Signal Nobody Could Hold Still
By the 1880s it was not news that the heart makes electricity. Physiologists had known since the middle of the century that contracting muscle generates a current, and in 1887 the London physiologist Augustus Desiré Waller, working at St Mary's Hospital, recorded the electrical activity of a human heart from the intact chest wall — the first human electrocardiogram. His instrument was the Lippmann capillary electrometer: a thin glass tube containing a column of mercury under sulphuric acid, in which the mercury meniscus shifts slightly when a voltage is applied. Photograph the moving meniscus and you have a record.
Waller's public demonstrations became famous partly because of his bulldog, Jimmy, who would stand patiently with his paws in jars of saline solution while the audience watched his heartbeat appear as a wobble of light. It made the point beautifully: the electricity of a beating heart could be caught from outside the body. Waller became, briefly, the object of an anti-vivisection controversy over the dog, which appears to have suffered nothing worse than wet feet.
The trouble was that the capillary electrometer was slow. Mercury has mass and the acid has viscosity, so the meniscus lagged behind the signal driving it, smearing sharp events into rounded humps and flattening fast spikes into gentle rises. What came out was not the heart's electrical activity; it was the heart's electrical activity as blurred by the instrument. Waller could show that a signal existed. He could not show its shape, and shape is where all the diagnostic information lives.
Waller himself was famously unimpressed by his own invention's future. In a lecture given a few years later he suggested that he did not imagine electrocardiography was likely to find any very extensive use in the hospital — that it might be of rare and occasional use, to record some unusual anomaly of cardiac action. The remark is quoted so often in the history-of-medicine literature that its exact wording varies between retellings, so treat it as a well-attested sentiment rather than a verbatim transcript. The sentiment is what matters. The man who first recorded a human heartbeat electrically thought the technique would end up a curiosity. It is now performed hundreds of millions of times a year worldwide.
Einthoven's first serious contribution, in the 1890s, was to attack the blurring mathematically. He worked out the physical behaviour of the capillary electrometer — its inertia and damping — and derived a correction that let him reconstruct, from the smeared trace, the sharp curve that must have produced it. Those corrected curves from around 1895 are the first recognisably modern electrocardiograms, and they matter for a reason that comes up again in section 4: because they were reconstructions rather than direct recordings, Einthoven needed a new set of labels to distinguish them from Waller's raw tracings.
A mathematical correction, however, is an argument, not a measurement. To settle the argument he needed an instrument fast enough to record the true curve directly.
3. The String Galvanometer, 1901
The device Einthoven announced in 1901 is one of those inventions that looks obvious the moment you see it and required an unreasonable amount of craft to build.
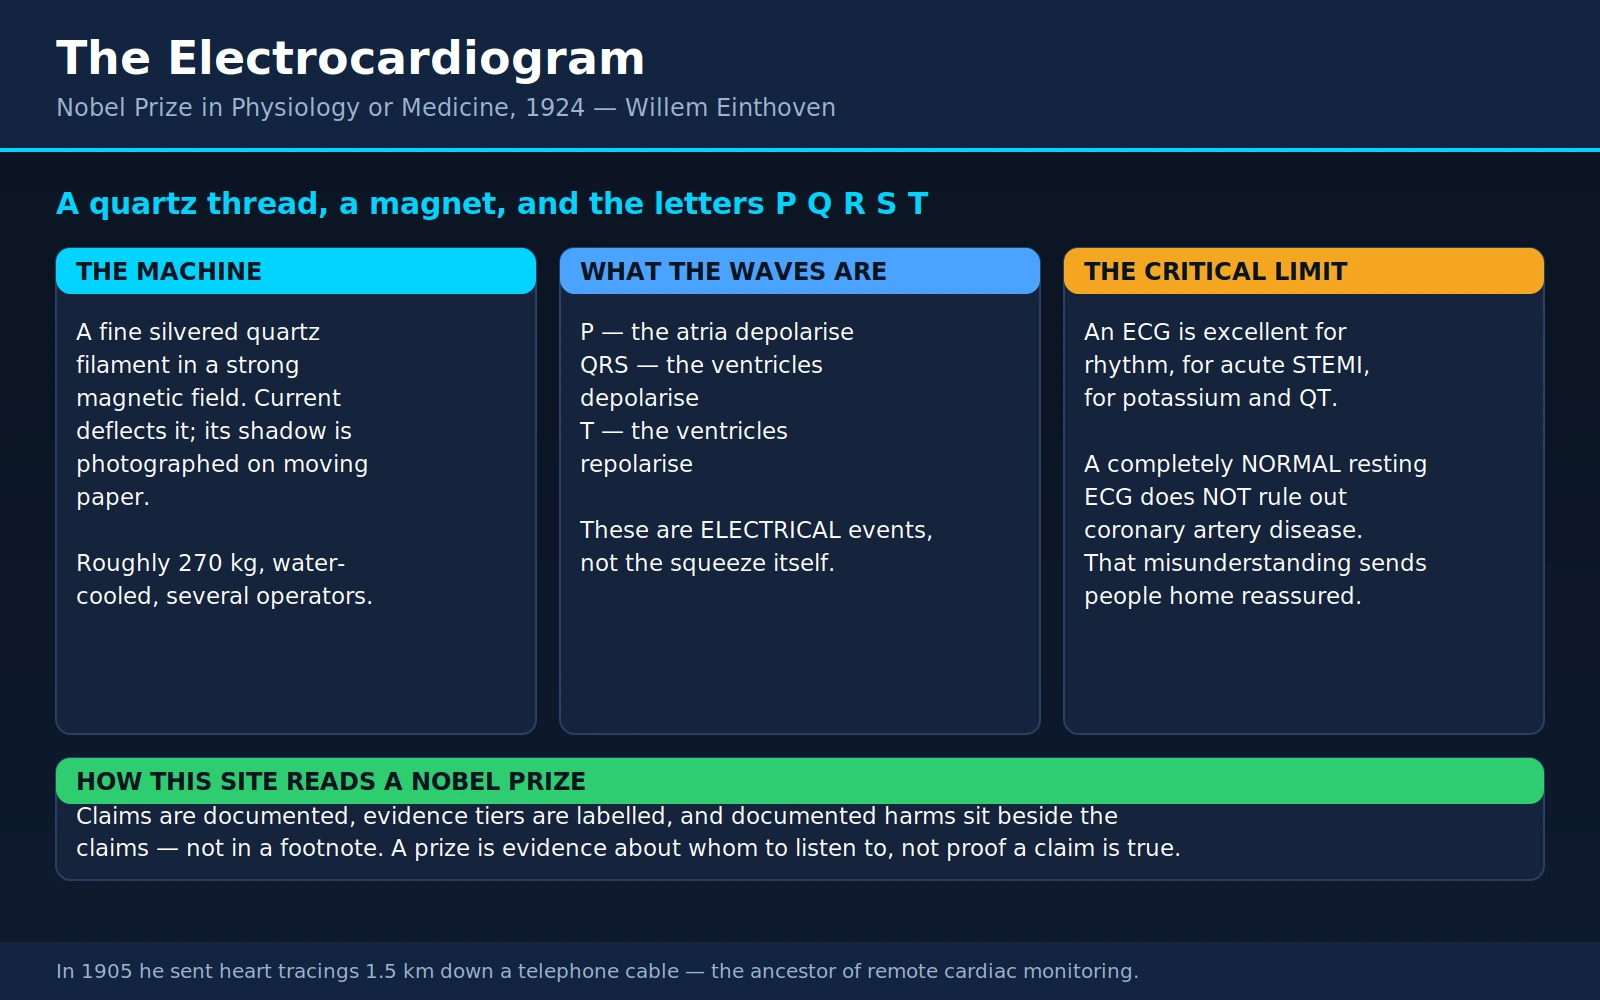
Take an extremely fine conducting filament — a quartz fibre only a few thousandths of a millimetre thick, thinner than spider silk, coated with silver to make it conduct — and suspend it under tension between the poles of a powerful electromagnet. Run the tiny current from the body's surface through that filament. A current-carrying wire in a magnetic field experiences a sideways force, so the string swings. Because the string has almost no mass, it swings fast: it can follow the heart's electrical events in something close to real time instead of lagging behind them like a column of mercury.
Then comes the elegant part. Rather than trying to read a deflection that is microscopic, Einthoven shone a light through the gap, magnified the shadow of the string with a projection microscope, and cast that shadow onto a moving photographic plate. What develops is a continuous curve of voltage against time — the shadow of a vibrating thread, several hundred times life size. Every electrocardiogram since is a descendant of that shadow.
Making the fibre at all was its own problem. The standard account is that Einthoven produced quartz filaments of the necessary fineness by melting quartz and drawing it out at enormous speed — attaching molten quartz to an arrow and firing it from a bow across the laboratory. Whether or not the bow was used every time, the difficulty is real: the string had to be fine enough to be fast, uniform enough not to distort, and strong enough not to snap under tension.
The finished apparatus was not a bedside device. Reported figures vary between sources and should be treated as approximate, but the original Leiden instrument is generally described as weighing on the order of 270 kg (roughly 600 lb), occupying two rooms, requiring around five people to operate, and needing water cooling for the electromagnets that produced its field. The patient sat with both hands and one foot immersed in buckets of saline solution, which served as the electrodes. Nothing about it suggested a routine test.
Einthoven published the first full accounts in Dutch in 1901 and in German in Pflügers Archiv in 1903, where he compared his galvanometric recordings directly against the capillary electrometer and showed what the older instrument had been hiding. From 1908 the Cambridge Scientific Instrument Company in England began building commercial versions, and the technique started to spread — slowly, because early buyers needed a dedicated room and a technician. Within about two decades the string galvanometer had been miniaturised, and by mid-century vacuum-tube amplification made the string itself unnecessary. The physics moved on; the output did not. A modern ECG produces exactly the kind of curve Einthoven's shadow drew.
4. The Letters P, Q, R, S and T
Waller had labelled the deflections of his tracings with the early letters of the alphabet. Einthoven labelled his corrected curves P, Q, R, S and T, and those letters have been the vocabulary of cardiology ever since.
Why those letters? Two explanations are given in the historical literature and neither can be proved from Einthoven's own words, so it is honest to present both. The first is that using a later, unused stretch of the alphabet kept his corrected curves clearly distinct from the uncorrected A–B–C–D tracings already in circulation, and left room on either side for waves that had not yet been named — which turned out to be prescient, because the U wave was later added after T. The second is a nod to mathematical convention: since Descartes it has been usual to reserve the letters near the end of the alphabet for unknown quantities in geometry, and Einthoven, whose training was thoroughly mathematical, may simply have been following the habit of his discipline. Both stories are plausible, both are repeated by serious historians, and no surviving statement settles it.
What the letters mean is not in doubt. Here is the plain-language version.
- P wave — the small rounded bump that starts each beat. It is the electrical wave spreading across the two upper chambers, the atria: atrial depolarisation. On a normal tracing there is one P wave in front of every QRS complex, and it looks the same each time.
- QRS complex — the tall, narrow spike. This is the electrical wave sweeping through the ventricles, the two big pumping chambers: ventricular depolarisation. Q is a small downward deflection before the spike, R is the upward spike itself, S is the downward deflection after it. Not every beat shows all three; the whole cluster is still called the QRS.
- T wave — the broader bump after the spike. This is the ventricles resetting electrically, ready for the next beat: ventricular repolarisation.
- U wave — a small, often invisible bump sometimes seen after T. Its origin is still argued about; a prominent U wave can be a clue to low potassium.
The atria also have to reset, but their repolarisation wave is small and happens underneath the QRS complex, which is far larger — so it is normally invisible. That is a good example of a general truth about the ECG: it shows you what is electrically loud, not what is clinically important.
Now the caveat that most people never hear, and that changes how you should think about the whole test. Every one of these waves is an electrical event, not a mechanical one. The QRS complex is the signal telling the ventricles to contract; it is not the contraction. In cardiac arrest with what is called pulseless electrical activity, the ECG can continue producing perfectly organised complexes while the heart is not pumping any blood at all — the wiring is firing, the muscle is not answering. This is why a monitor showing a "normal-looking rhythm" is never, on its own, evidence that someone has a circulation, and why the ECG has to be interpreted alongside a pulse, a blood pressure, an echocardiogram, or a blood test. It is a recording of the heart's instructions, not of its work.
5. Einthoven's Triangle and the Leads
If the heart's electrical wave were a simple on-off signal, one recording would do. It is not. The wave has a direction in three-dimensional space, and it changes direction continuously as it sweeps across the muscle. A single recording tells you only how much of that wave happens to be pointing along the one line you happen to be measuring.
Einthoven's solution was to record from more than one direction and treat the results as a geometry problem. He placed electrodes on the right arm, left arm and left leg (the right leg serves as an electrical reference), and defined three recordings:
- Lead I — right arm to left arm, looking across the chest more or less horizontally.
- Lead II — right arm to left leg, looking diagonally down the body.
- Lead III — left arm to left leg, the third side of the shape.
Those three lines form a triangle around the heart — Einthoven's triangle — and he modelled it as equilateral, with the heart at its centre. From that model comes Einthoven's law, one of the few genuinely useful pieces of arithmetic on an ECG report:
Lead I + Lead III = Lead II
At any instant, the voltage in lead II should equal the sum of the voltages in leads I and III. This is not a biological finding; it follows from the geometry. Which makes it a real, free internal consistency check: if the arithmetic does not hold on a printed tracing, something is wrong with the recording, not with the patient. The classic culprit is reversed arm electrodes, which is one of the most common technical errors in clinical practice and can produce a tracing that looks alarmingly abnormal. If you are ever told your ECG is strange and it was taken hastily, "was the lead placement checked?" is a fair and unembarrassing question.
Einthoven's three limb leads are still leads I, II and III today. Two later additions completed the modern test:
- Augmented limb leads (aVR, aVL, aVF), introduced by Emanuel Goldberger in the early 1940s, extract three more frontal-plane views from the same three electrodes — six angles from three wires.
- Precordial (chest) leads V1 to V6, developed on the foundation of Frank Wilson's "central terminal" in the 1930s, place six electrodes in an arc across the front and left of the chest. These look at the heart in the horizontal plane, effectively from the front and around the left side.
Together that is the standard 12-lead ECG: ten electrodes, twelve viewpoints, one set of heartbeats. It is worth being clear that a 12-lead ECG is not twelve tests. It is twelve simultaneous camera angles on the same few seconds of electrical activity. That is why the location of an abnormality can be inferred at all — a change confined to leads II, III and aVF points at the underside of the heart; changes across V1–V4 point at the front. And it is also why a single-lead device, such as the one in a smartwatch, is a fundamentally different instrument rather than a smaller version of the same one. It has one camera angle, roughly equivalent to Einthoven's lead I. Section 9 returns to what that costs.
6. Telecardiograms: Remote Monitoring in 1905
Here is the detail that most surprises people. Einthoven's laboratory was about a mile and a half from the Academic Hospital in Leiden, and moving patients to a 270-kilogram instrument in a university physiology department was obviously impractical. So in 1905 he had a telephone cable roughly 1.5 km long run between the hospital and his laboratory, and transmitted the electrical signal from patients at the hospital to the string galvanometer in his lab, where it was recorded.
He called the results telecardiograms, and published an account under that name in 1906. A hospital clinician could place the electrodes on a patient; a mile away, the tracing appeared. Coordination was by telephone.
Set aside the charm and notice what it establishes. In 1905, the electrocardiogram was already understood to be a signal that could be separated from the patient — something transmissible, recordable elsewhere, and interpretable by a specialist who was not in the room. Everything that followed from that idea — ambulance ECGs sent ahead to the receiving hospital so the catheter lab is ready before arrival, Holter monitors, event recorders, implantable loop recorders, hospital telemetry wards, cardiology over-reads performed remotely, and the ECG in a wristwatch that emails a PDF to a physician — is a straight line from a cable Einthoven laid under a Dutch street. The 1906 paper is also notable for what it recorded: over the following years he published tracings of enlarged ventricles, of atrial fibrillation, of complete heart block, matching electrical patterns to conditions and giving the instrument its clinical vocabulary.
7. What an ECG Can and Cannot Tell You
This is the practical core of the page. The electrocardiogram is superb at some things, useless at others, and the gap between those two categories is where most patient misunderstanding lives.
What the ECG does well
- Rhythm. This is what it was born for and it remains unbeaten. Atrial fibrillation, atrial flutter, the various supraventricular tachycardias, ventricular tachycardia, the degrees of heart block, pauses, and abnormally slow or fast rates are all diagnosed on the ECG and essentially only on the ECG. If the question is "what is the electrical rhythm of this heart right now", nothing else comes close.
- ST-elevation myocardial infarction. When a coronary artery is completely blocked and a full-thickness area of heart muscle is dying, the ECG usually shows a characteristic pattern of ST-segment elevation. This is the finding that activates an emergency pathway and sends a person straight to the catheter laboratory, often bypassing the emergency department entirely. Minutes matter, and the ECG is the trigger.
- Dangerous potassium levels. High potassium produces a recognisable progression — tall peaked T waves, then flattening P waves and a lengthening PR interval, then a widening QRS, ultimately a sine-wave pattern preceding arrest. Low potassium can flatten T waves and bring out U waves. This is genuinely useful when present, and section 7's caveats below explain why "when present" is doing heavy lifting.
- QT prolongation. The QT interval measures how long the ventricles take to reset. When it is too long, the heart becomes vulnerable to a dangerous rhythm called torsades de pointes. Many common drugs prolong it, as do low potassium and low magnesium, and some people inherit long QT syndrome. An ECG before or after starting certain medicines exists precisely to check this.
- Structural clues. Voltage criteria suggesting a thickened left ventricle, patterns suggesting an enlarged atrium, evidence of an old infarct in the form of Q waves, bundle branch blocks, pericarditis, the strain pattern of a large pulmonary embolism. These are clues — they raise or lower suspicion and direct the next test. They are not the diagnosis.
The limitation that matters most
A normal resting ECG does not mean your coronary arteries are clear.
This deserves stating without qualification, because it is the single most consequential misunderstanding patients have about the test, and because being reassured by it has cost lives. An ECG is not a picture of your arteries. It is a recording of electrical activity. A coronary artery can be seriously narrowed by atherosclerotic plaque — badly enough to cause angina on exertion, badly enough to rupture next month and cause a heart attack — while the heart muscle it supplies is receiving enough blood at rest to behave electrically as though nothing were wrong. Nothing appears on the tracing because, at that moment, nothing electrical is happening that is abnormal.
The evidence for this is not subtle. A registry analysis of 391,208 patients with confirmed acute myocardial infarction classified their initial ECG on arrival: it was normal in 30,759 patients and non-specific in 137,574. In other words, roughly one in thirteen people having a genuine heart attack had a normal first ECG, and about another third had only non-specific changes. Their in-hospital mortality was lower than that of patients with a diagnostic ECG — 5.7% versus 11.5% — but the authors' own conclusion was that the absolute rates in the "reassuring ECG" groups were still unexpectedly high (Welch et al., JAMA 2001; citation 5 below).
The practical consequences:
- Chest pain is not ruled out by one normal ECG. This is why emergency departments repeat the ECG, and why they measure cardiac troponin — a protein released when heart muscle cells are damaged — usually on arrival and again a few hours later. The ECG answers "is there a big artery blocked right now"; troponin answers "has heart muscle been injured"; they are different questions, and current chest pain guidelines are built around using both.
- A normal ECG at a health check is not a clean bill of coronary health. If the question is whether you have coronary plaque, the tests that answer it are anatomical or functional: a coronary calcium score, CT coronary angiography, a stress test with imaging, or invasive angiography. Not a resting ECG.
- Even the potassium example has limits. A retrospective review of patients with genuine hyperkalaemia found the ECG to be insensitive for detecting it, with no reliable threshold for T-wave peaking and only moderate agreement between readers — the authors concluded management should be guided by the clinical picture and serial potassium measurements, not by the tracing (Montague et al., 2008; citation 6). A normal-looking ECG does not exclude a dangerous potassium level either.
None of this makes the ECG a bad test. It makes it a specific test. Used for what it is good at, it is close to irreplaceable. Used as a general reassurance device, it is actively misleading.
8. Reading Your Own Tracing
You are not going to out-read a cardiologist, and you should not try. But you can become a great deal more competent than the average patient, and the pay-off is real: fewer nights of unnecessary fear, better questions in the consulting room, and the ability to tell the difference between a report that says something and a report that says nothing.
The grid
Standard ECG paper runs at 25 mm per second with a calibration of 10 mm per millivolt. That gives you the two numbers you need:
- One small square is 1 mm wide = 0.04 seconds (40 milliseconds).
- One large square is 5 mm wide = 0.20 seconds.
- Five large squares = one second. A standard printed strip usually represents 10 seconds.
A small square calibration mark — a rectangular step at the start of the tracing — confirms the settings. If the paper speed or gain has been changed, every interval and height on the tracing changes with it, which is one reason automated measurements occasionally go strange.
Heart rate from the R–R interval
The R waves are the tall spikes. The gap between two consecutive R waves is the R–R interval, and it is the length of one heartbeat.
- The 300 rule. Count the number of large squares between two R waves and divide 300 by it. Two large squares between spikes is 150 beats per minute; three is 100; four is 75; five is 60; six is 50. Memorising the sequence 300, 150, 100, 75, 60, 50 lets you read a rate off a strip in a second or two.
- The 1500 rule, for more precision: divide 1500 by the number of small squares between R waves.
- The 10-second rule, which is the only one that works when the rhythm is irregular: count the QRS complexes on a full 10-second strip and multiply by 6.
That last point matters. In an irregular rhythm there is no single R–R interval, so any method based on measuring one gap gives a meaningless answer. Count over the whole strip instead.
Regular or irregular
Mark the position of three or four consecutive R waves on the edge of a piece of paper, slide it along the strip, and see whether the marks keep landing on the spikes. This is genuinely how it is done, and it is what separates the two great families of rhythm problems. A regular rhythm that is too fast or too slow behaves differently from one that is chaotically irregular. Irregularly irregular — no discernible pattern to the spacing at all, and no visible P waves — is the signature of atrial fibrillation.
What the words on the report mean
- "Normal sinus rhythm" — the beat is starting where it should (the sinus node, in the right atrium), spreading normally, at a rate conventionally taken as 60–100 beats per minute. It says the rhythm is normal. It says nothing about your arteries.
- "Sinus bradycardia" — normal rhythm, rate under 60. Extremely common in fit people and during sleep; abnormal mainly if it is causing symptoms.
- "Sinus tachycardia" — normal rhythm, rate over 100. A response, not a disease: pain, fear, fever, dehydration, anaemia, an overactive thyroid, caffeine, alcohol withdrawal, or simply having climbed the stairs to the clinic.
- "Sinus arrhythmia" — the rate speeding slightly on inhalation and slowing on exhalation. Normal, and in the young a sign of a healthy autonomic nervous system, despite the ominous word.
- "Non-specific ST-T changes" — the single most common abnormal-looking phrase on ECG reports, and the emptiest. It means the repolarisation pattern is not textbook and the machine cannot say why. It is often normal variation, body habitus, position, or an old tracing pattern of no consequence.
- "Poor R-wave progression" — the R waves do not grow across the chest leads as expected. It is frequently explained by nothing more than electrode placement or chest shape.
- "Possible", "cannot exclude", "consider" — machine hedging. These phrases are algorithmic caution, not clinical findings.
Why the computer's verdict is so often wrong
Nearly every ECG performed today is analysed automatically the instant it is recorded, and the machine's interpretation prints across the top of the page — where the patient reads it first and takes it as the answer.
It is not the answer. A review of computerised ECG interpretation in the Journal of the American College of Cardiology put it bluntly: limitations in the diagnostic accuracy of automated interpretation were recognised early and persist, inexperienced physicians may fail to recognise the mistakes and accept the automated diagnosis uncritically, and clinical mismanagement can result — exposing patients to useless investigations or dangerous treatment. The authors' conclusion is that over-reading and confirmation by an experienced ECG reader are essential, a recommendation that has been made repeatedly in the published literature (Schläpfer and Wellens, 2017; citation 7).
The algorithm over-calls in predictable directions. It flags young people, whose normal ECGs often show high voltages and early repolarisation patterns that look like disease criteria written for sixty-year-olds. It flags athletes, for reasons below. It flags women, tall people, thin people, and anyone whose electrode placement was a few centimetres off. So if a printout says something frightening:
- Check whether a human has signed it. An ECG with a cardiologist's or physician's over-read is a different document from a raw machine printout.
- Ask for the comparison with any previous tracing. "Unchanged from 2019" resolves an enormous fraction of scary-looking findings.
- Ask whether the finding is expected for your age, sex, build and fitness.
Athlete's heart versus disease
Sustained endurance training remodels the heart. Chambers enlarge, walls thicken modestly, resting vagal tone rises, and the ECG changes accordingly — sinus bradycardia sometimes into the 30s at rest, high QRS voltages, early repolarisation, and first-degree AV block are all common and, in a trained athlete, usually normal adaptations rather than disease.
The difficulty is that some of those changes overlap with the appearance of hypertrophic cardiomyopathy and other conditions that cause sudden death in young athletes. Distinguishing physiology from pathology is a genuine specialist skill, and it is the reason a set of international ECG interpretation criteria specifically for athletes was developed and published in 2017 (citation 13) — sorting findings into normal training-related changes, borderline findings, and abnormal findings requiring investigation. Those criteria substantially reduced false-positive referrals compared with earlier standards. The honest summary for a fit person handed an "abnormal ECG": it may well be your training, but it should be read by someone who knows the athlete criteria, not dismissed by you and not over-treated by a machine.
9. Wearables and Consumer ECG
Einthoven's instrument now exists in a watch. That is a remarkable thing, and it deserves a clear-eyed assessment rather than either enthusiasm or dismissal.
Two different technologies, often confused
Consumer devices do two distinct things, and the difference explains most of the confusion:
- Optical pulse sensing (PPG) — green LEDs on the underside of the watch measure blood-volume changes in the wrist. This runs in the background and produces the "irregular rhythm notification". It is not an ECG. It infers irregular timing of pulses.
- Single-lead ECG — touching a finger of the opposite hand to the crown or bezel completes a circuit across the chest, producing a true electrical recording roughly equivalent to Einthoven's lead I. One angle, thirty seconds, and a verdict of sinus rhythm, atrial fibrillation, high or low heart rate, or inconclusive.
What the large trials actually showed
The Apple Heart Study (New England Journal of Medicine, 2019; citation 9) enrolled 419,297 participants. Over a median of 117 days, 2,161 — 0.52% — received an irregular pulse notification. Of the 450 who returned an analysable ECG patch, atrial fibrillation was present in 34%. The positive predictive value of a notification was 0.84 for observing atrial fibrillation on the patch at the same time as a subsequent notification. And a detail worth dwelling on: of 1,376 notified participants who answered a 90-day survey, 57% contacted a health care provider outside the study.
The Fitbit Heart Study (Circulation, 2022; citation 10) enrolled 455,699 participants with a median age of 47. An irregular heart rhythm detection occurred in 4,728 (1%) of participants overall. Among 1,057 who had a notification and then wore an analysable ECG patch, atrial fibrillation was present in 340 (32.2%). Where a second irregular detection occurred while the patch was on, the positive predictive value was very high — 98.2% — meaning the algorithm is excellent at confirming itself, which is a narrower claim than it first sounds.
Read those two studies together and a fair summary emerges. The detection is real: these devices genuinely find previously undiagnosed atrial fibrillation in people who did not know they had it, which is a meaningful achievement. The yield is modest: about one in a hundred to one in two hundred users gets notified over several months. And roughly two-thirds of notified people did not have atrial fibrillation on subsequent monitoring, which generated telemedicine visits, patch monitors, clinic appointments, and, in the real world outside a trial, echocardiograms and specialist referrals. That downstream burden is not a footnote; it is a major part of the cost-benefit calculation, and it falls hardest on younger users, in whom atrial fibrillation is rare and false positives correspondingly more common.
The hard limit, stated plainly
A single-lead consumer ECG cannot diagnose a heart attack, and must never be used to decide whether chest pain needs emergency care.
The manufacturers say this themselves in their own labelling: the ECG features are intended to identify atrial fibrillation and normal sinus rhythm, and are explicitly not intended to detect heart attack, blood clots, stroke, or other heart conditions. The reason is structural, not a software shortcoming. Recognising a myocardial infarction depends on seeing ST-segment changes in a pattern across territories — inferior, anterior, lateral — which requires the multiple simultaneous viewing angles described in section 5. One lead cannot do it. And beyond that: as section 7 established, even a full 12-lead ECG interpreted by a cardiologist misses a meaningful fraction of genuine heart attacks.
So the instruction is simple and it does not have exceptions. Chest pain or pressure lasting more than a few minutes, particularly with shortness of breath, sweating, nausea, light-headedness, or pain spreading to the arm, jaw, neck or back, means calling emergency services now. Not taking a watch reading. Not waiting for the reading. Not being reassured by "sinus rhythm" on a screen. Those symptoms may present differently in women, in older people, and in people with diabetes, where breathlessness, fatigue, or nausea can dominate and chest pain can be mild or absent. A reassuring watch reading in that situation is not information. It is a delay.
Where wearables genuinely earn their place
- Capturing intermittent palpitations. The classic clinical frustration is the patient whose symptoms come every three weeks and whose 24-hour Holter monitor was, inevitably, normal. A wearable that is present when the symptom happens can capture a tracing no clinic visit would ever have caught. Bring it to your appointment as a PDF.
- Monitoring known atrial fibrillation. For someone already diagnosed, tracking burden and correlating symptoms is legitimately useful, in cooperation with their clinician.
- Prompting a first diagnosis in an older, higher-risk user. This is the population where a notification is most likely to be a true positive and most likely to change treatment.
10. Atrial Fibrillation, Since That Is What Watches Find
Given that essentially all consumer detection is aimed at one arrhythmia, it is worth a short, calm description of what it is.
In atrial fibrillation, the electrical activity in the atria becomes disorganised. Instead of one coordinated wave producing one clean P wave, there is continuous chaotic activity, and the ventricles are triggered irregularly — hence the irregularly irregular pulse and the absent P waves on the tracing. It is the most common sustained heart-rhythm disorder; the US Preventive Services Task Force noted prevalence of roughly 3% of men and 2% of women aged 65–69, rising to about 10% of adults aged 85 and older (citation 12).
Symptoms, when present, are palpitations, breathlessness, reduced exercise tolerance, or fatigue. But a substantial proportion of people have no symptoms at all, which is exactly why screening is discussed and why watches find it.
The reason clinicians take it seriously is stroke. When the atria quiver rather than contract, blood can pool and clot, most often in the left atrial appendage; a clot that travels reaches the brain. The same USPSTF review noted that atrial fibrillation increases stroke risk by as much as fivefold, and that approximately 20% of people who have a stroke associated with atrial fibrillation are first diagnosed with the arrhythmia at the time of the stroke or shortly afterwards. That last figure is the whole argument for detection.
Treatment has three separable strands, and they are decided individually rather than by formula:
- Stroke prevention — whether anticoagulation is warranted, based on a person's individual risk profile using a formal risk score, weighed against their bleeding risk. This is the decision that matters most.
- Rate control — keeping the ventricular rate reasonable, whether or not the fibrillation itself is corrected.
- Rhythm control — attempting to restore and maintain normal rhythm, with medication, electrical cardioversion, or catheter ablation.
Alongside these sits management of the things that drive it: high blood pressure, sleep apnoea, alcohol intake, obesity, thyroid disease, and often magnesium and potassium status where these are disturbed. Nothing in this section is a substitute for individual clinical assessment, and if a watch has told you that you may have atrial fibrillation, the correct next step is a proper ECG and a conversation — not alarm, and not ignoring it either.
11. Where Mainstream Medicine Agrees — and What Remains Debated
Where there is broad agreement
- The ECG is the definitive test for cardiac rhythm and conduction abnormalities.
- The ECG is the trigger for emergency reperfusion in ST-elevation myocardial infarction, and speed of acquisition is a quality measure.
- A normal ECG does not exclude coronary artery disease, and does not rule out an acute coronary syndrome. Serial ECGs plus troponin measurement are the standard approach to chest pain, as reflected in current chest-pain guidelines (citation 8).
- Automated interpretation requires expert over-reading before it is acted on (citation 7).
- An ECG is appropriate when there is a reason: symptoms, an abnormal examination, a relevant medication, a relevant family history, or a known condition.
Screening ECGs in asymptomatic adults: not recommended, and here is why
If you have been offered a resting ECG as part of a private health check or an executive medical, you deserve the reasoning rather than a shrug.
The US Preventive Services Task Force reviewed the evidence in 2018 and issued a two-part conclusion (citation 11). For asymptomatic adults at low cardiovascular risk — a 10-year event risk under 10% — it recommends against screening with resting or exercise ECG: a D recommendation. For asymptomatic adults at intermediate or high risk, it found the evidence insufficient to weigh benefits against harms: an I statement.
The reasoning is worth understanding because it generalises to a great many screening tests:
- It rarely changes what happens next. Risk is already estimated from age, blood pressure, cholesterol, smoking, diabetes and family history. The Task Force concluded that in low-risk adults it is very unlikely that adding an ECG would move someone into a different risk category in a way that changes treatment and improves outcomes.
- The harms are real and one-directional. Screening a population with a low prevalence of disease produces a high proportion of false positives. Each one starts a cascade: repeat testing, stress imaging, CT angiography with its contrast and radiation, sometimes invasive angiography with its small but genuine risk of bleeding, kidney injury, arterial damage, stroke or death. The Task Force named the potential adverse effects of subsequent invasive testing explicitly.
- It can mislead in the reassuring direction. Everything in section 7 applies. A normal screening ECG in a smoker with a strong family history can produce exactly the false confidence that delays a genuinely useful conversation.
The USPSTF also issued an I statement for screening for atrial fibrillation with ECG in adults aged 65 and over (citation 12) — not because atrial fibrillation does not matter, but because the evidence that systematically screening for it and treating what is found produces better outcomes than usual care was judged inadequate at the time.
What has happened since is genuinely instructive, because two large randomised trials reported in the same issue of The Lancet in 2021 and neither delivered a clean answer:
- STROKESTOP (citation 14) randomised 28,768 Swedish 75- and 76-year-olds to invitation to screening or control, with intermittent ECGs over 14 days for those who attended, and followed them for a median of 6.9 years. The composite primary endpoint favoured screening, but only just: a hazard ratio of 0.96 (95% CI 0.92–1.00), p=0.045. A small net benefit, at the edge of statistical significance, in a population aged 75, with only 51.3% of those invited actually taking part.
- The LOOP study (citation 15) went much further, implanting continuous loop recorders in 1,501 people aged 70–90 with a stroke risk factor and comparing them with 4,503 receiving usual care. Continuous monitoring found vastly more atrial fibrillation — 31.8% versus 12.2% — and led to far more anticoagulation, 29.7% versus 13.1%. But the primary outcome, stroke or systemic embolism, was 4.5% versus 5.6%, hazard ratio 0.80 (95% CI 0.61–1.05), p=0.11 — not statistically significant.
That LOOP result is the most important single finding for anyone thinking about consumer atrial-fibrillation detection. Finding far more atrial fibrillation, and treating far more of it, did not translate into a clearly demonstrated reduction in stroke. Brief, screen-detected episodes may simply not carry the same risk as clinically apparent, symptomatic atrial fibrillation. This is unresolved, actively researched, and the honest position is that more detection is not automatically more benefit.
Athlete pre-participation screening: the genuinely contested case
This is the sharpest live disagreement in the field, and both sides have serious evidence.
The case for screening. Italy has required ECG-based pre-participation screening for competitive athletes nationally since 1982. A population-based analysis of the Veneto region from 1979 to 2004 found the annual incidence of sudden cardiovascular death in screened athletes fell by 89% — from 3.6 to 0.4 per 100,000 person-years — while the incidence in the unscreened non-athletic population of the same age range did not change significantly. Most of the reduction was in deaths from cardiomyopathies, exactly the conditions ECG screening is meant to catch, and the proportion of athletes disqualified for cardiomyopathy rose over the same period (Corrado et al., JAMA 2006; citation 16). That internal consistency is what makes the study persuasive.
The case against. Sudden cardiac death in young athletes is rare, so screening millions to prevent a small number of deaths means large numbers of false positives, each carrying anxiety, further testing, cost, and sometimes wrongful disqualification from a sport that is central to a young person's life. The Veneto data are observational rather than randomised, and other countries have not reproduced the effect. Major bodies have landed in different places: European guidance has generally favoured ECG in the screening of competitive athletes, while American guidance has traditionally recommended history and physical examination without routine ECG.
What has moved the debate. The strongest objection to ECG screening was always the false-positive rate, and that is a technical problem with a technical answer. The development of athlete-specific interpretation criteria — culminating in the international recommendations published in 2017 (citation 13) — substantially cut false positives by formally separating normal training-related changes from findings that require investigation. The debate is now less "does the ECG find things" and more "who reads it, against which criteria, and what does the system do next". That is a considerably more tractable question than the one being argued twenty years ago.
12. Key Research Papers
A note on Einthoven's own publications. His primary papers were published between 1901 and 1913, mostly in Dutch and German journals that predate the PubMed record, so they cannot be given PMIDs. They are, for the record:
- Einthoven W. Un nouveau galvanomètre. Archives Néerlandaises des Sciences Exactes et Naturelles, 1901 — the string galvanometer announced.
- Einthoven W. Die galvanometrische Registrirung des menschlichen Elektrokardiogramms, zugleich eine Beurtheilung der Anwendung des Capillar-Elektrometers in der Physiologie. Pflügers Archiv, 1903 — the string galvanometer's recordings set directly against the capillary electrometer's.
- Einthoven W. Le télécardiogramme. Archives Internationales de Physiologie, 1906 — transmission of the ECG by telephone cable.
- Einthoven W. The different forms of the human electrocardiogram and their signification. The Lancet, 1912 — his own account in English, delivered as a lecture in London.
- Einthoven W, Fahr G, de Waart A. Pflügers Archiv, 1913 — the formal treatment of the equilateral triangle and the direction and magnitude of the heart's potential.
Searchable starting points for those: Einthoven string galvanometer and Einthoven telecardiogram.
The papers below are all indexed, and each has been checked against the PubMed record for journal, year, volume and pages.
- Fye WB. A history of the origin, evolution, and impact of electrocardiography. Am J Cardiol 1994;73(13):937-49
- Rivera-Ruiz M, Cajavilca C, Varon J. Einthoven's string galvanometer: the first electrocardiograph. Tex Heart Inst J 2008;35(2):174-8
- Barold SS. Willem Einthoven and the birth of clinical electrocardiography a hundred years ago. Card Electrophysiol Rev 2003;7(1):99-104
- Pahlm O, et al. The winner takes it all: Willem Einthoven, Thomas Lewis, and the Nobel prize 1924 for the discovery of the electrocardiogram. J Electrocardiol 2019;57:122-127
- Welch RD, Zalenski RJ, Frederick PD, et al. Prognostic value of a normal or nonspecific initial electrocardiogram in acute myocardial infarction. JAMA 2001;286(16):1977-84
- Montague BT, Ouellette JR, Buller GK. Retrospective review of the frequency of ECG changes in hyperkalemia. Clin J Am Soc Nephrol 2008;3(2):324-30
- Schläpfer J, Wellens HJ. Computer-interpreted electrocardiograms: benefits and limitations. J Am Coll Cardiol 2017;70(9):1183-1192
- Gulati M, Levy PD, Mukherjee D, et al. 2021 AHA/ACC/ASE/CHEST/SAEM/SCCT/SCMR guideline for the evaluation and diagnosis of chest pain. J Am Coll Cardiol 2021;78(22):e187-e285
- Perez MV, Mahaffey KW, Hedlin H, et al. Large-scale assessment of a smartwatch to identify atrial fibrillation. N Engl J Med 2019;381(20):1909-1917
- Lubitz SA, Faranesh AZ, Selvaggi C, et al. Detection of atrial fibrillation in a large population using wearable devices: the Fitbit Heart Study. Circulation 2022;146(19):1415-1424
- US Preventive Services Task Force; Curry SJ, Krist AH, Owens DK, et al. Screening for cardiovascular disease risk with electrocardiography: US Preventive Services Task Force recommendation statement. JAMA 2018;319(22):2308-2314
- US Preventive Services Task Force; Curry SJ, Krist AH, Owens DK, et al. Screening for atrial fibrillation with electrocardiography: US Preventive Services Task Force recommendation statement. JAMA 2018;320(5):478-484
- Sharma S, Drezner JA, Baggish A, et al. International recommendations for electrocardiographic interpretation in athletes. J Am Coll Cardiol 2017;69(8):1057-1075
- Svennberg E, Friberg L, Frykman V, et al. Clinical outcomes in systematic screening for atrial fibrillation (STROKESTOP): a multicentre, parallel group, unmasked, randomised controlled trial. Lancet 2021;398(10310):1498-1506
- Svendsen JH, Diederichsen SZ, Højberg S, et al. Implantable loop recorder detection of atrial fibrillation to prevent stroke (the LOOP study): a randomised controlled trial. Lancet 2021;398(10310):1507-1516
- Corrado D, Basso C, Pavei A, et al. Trends in sudden cardiovascular death in young competitive athletes after implementation of a preparticipation screening program. JAMA 2006;296(13):1593-601
Live PubMed Searches
- Electrocardiogram history Einthoven
- Smartwatch atrial fibrillation detection
- ECG screening in asymptomatic adults
- Athlete ECG interpretation criteria
- Computerized ECG interpretation accuracy
13. Connections
- All Notable Doctors
- Nobel Prize in Medicine — the complete roll of laureates, 1901 to the present, with Einthoven's unshared 1924 prize in context
- Furchgott, Ignarro and Murad — nitric oxide as a signalling molecule in the cardiovascular system, and how nitroglycerin finally made sense
- Goldstein and Brown — the LDL receptor and cholesterol regulation, the other half of the coronary-disease story the ECG cannot see
- John Vane — how aspirin works, and why aspirin is given during a suspected heart attack
- Rosalyn Yalow — radioimmunoassay; cardiac troponin is measured by an immunoassay descended directly from her method
- Cardiology — the full index of heart and circulatory conditions
- Atrial Fibrillation — the arrhythmia consumer devices are built to detect, in depth
- Heart Block — conduction delay and its degrees, diagnosed on the ECG and essentially nowhere else
- Long QT Syndrome — why the QT interval is measured, and what lengthens it
- Atherosclerosis — the arterial disease a normal resting ECG cannot rule out
- Angina — chest pain on exertion, and why a resting tracing so often looks normal
- Coronary Artery Disease — what the ECG is being asked about, and which tests actually answer
- Hypertension — a driver of both atrial fibrillation and left ventricular hypertrophy on the tracing
- Cardiac Troponin — the blood test that answers the question the ECG cannot
- Coronary Calcium Score — an anatomical look at the arteries themselves
- Potassium — the mineral behind peaked T waves, and the reason the ECG alone cannot be trusted to detect its excess
- Magnesium — relevant to QT interval, arrhythmia risk and rhythm stability