Blood Sugar Remedies
This is the index for the pages covering what lowers, steadies, or measures blood glucose. It covers the botanicals with human trial data behind them, the vitamins and minerals that act on insulin signalling, the dietary patterns and meal-timing approaches that have been tested against post-meal glucose, the lab tests used to measure glucose control, and the conditions that sit downstream of chronic hyperglycemia.
The organising idea is that blood sugar is not a binary. In large cohort studies the risk of diabetes and of coronary heart disease rises across the range of glycated hemoglobin below the diabetic threshold, not only above it, so the material here is written for anyone who wants to understand glucose control — not only for people with a diagnosis. Each remedy below is labelled with the strength of the evidence actually behind it, including where that evidence is weak or where a well-known supplement has failed to replicate.
Table of Contents
- Why Blood Sugar Regulation Matters Beyond Diabetes
- How to Read the Evidence Here
- Glycemic Index and Glycemic Load
- Foods and Dietary Patterns
- Practices and Protocols
- Medicinal Mushrooms
- Pharmaceutical Comparators
- Measuring Blood Sugar
- Conditions Downstream of Blood Sugar
- Safety: The Hypoglycemia Interaction
- The History of Blood Sugar Medicine
- Key Research Papers
- External Authoritative Resources
- Connections
- Featured Videos
Why Blood Sugar Regulation Matters Beyond Diabetes
The conventional clinical framing treats blood sugar as a binary problem: a person either has diabetes (HbA1c ≥ 6.5%) or does not. Research complicates that framing in two ways. First, risk rises below the diabetic threshold. In the ARIC cohort of 11,092 adults without diabetes (Selvin et al. 2010), compared with an HbA1c of 5.0 to less than 5.5%, an HbA1c of 6.0 to less than 6.5% carried a hazard ratio of 4.48 for diagnosed diabetes and 1.78 for coronary heart disease; death from any cause followed a J-shaped curve rather than a straight line. Among older adults without diabetes in the Adult Changes in Thought study (Crane et al. 2013), higher average glucose was also associated with a higher risk of dementia. The American Diabetes Association classes an HbA1c of 5.7–6.4% as prediabetes and 6.5% or higher as diabetes (fasting plasma glucose 100–125 mg/dL and 126 mg/dL or higher; 2-hour oral glucose tolerance test 140–199 mg/dL and 200 mg/dL or higher). Second, HbA1c is a roughly three-month average that does not show postprandial excursions — two people with the same HbA1c can have very different post-meal glucose patterns.
The mechanism behind this continuous-risk relationship operates at multiple levels:
- Endothelial dysfunction — in clamp experiments (Ceriello et al. 2008), raising glucose to 10 or 15 mmol/l induced endothelial dysfunction (measured by flow-mediated dilation) and oxidative stress in people with and without type 2 diabetes, and glucose oscillating between 5 and 15 mmol/l did more harm than constant high glucose. Repeated post-meal spikes are proposed as one contributor to atherosclerosis, which is the rationale researchers give for studying post-meal walking.
- Advanced glycation end products (AGEs) — non-enzymatic glycation of long-lived proteins (collagen, hemoglobin, crystallins of the eye lens, basement membrane proteins of the kidney) accumulates over decades, driving microvascular complications and tissue stiffness.
- Insulin resistance and hyperinsulinemia — chronically elevated insulin (which accompanies insulin resistance before blood sugar rises) has been shown to stimulate ovarian androgen production, VLDL secretion and sodium retention by the kidney, and, in laboratory studies, the growth of certain cancer cell lines. The insulin resistance deep-dive covers the mechanism.
- Mitochondrial overload — chronic glucose excess drives overproduction of reactive oxygen species (superoxide) by the mitochondrial respiratory chain, the "unifying mechanism" of diabetic complications proposed by Brownlee (2005); downstream effects on NAD+, sirtuin activity and cellular senescence are an active research area.
The conceptual tools (glycemic index and load), the measurement tools (CGM), and the behavioral interventions (exercise and meal timing) have been studied in people without diabetes as well as in the roughly 12% of the US population that has diabetes, diagnosed or undiagnosed (CDC, 2023 data).
How to Read the Evidence Here
Blood sugar is a crowded corner of the supplement market, and the quality of the evidence behind the products in it varies widely. Three tiers are worth keeping separate, because a page that treats them alike is misleading even when every individual sentence is true.
- Human trial evidence, replicated. A randomised trial in people with measured glucose or HbA1c endpoints, confirmed by at least one independent meta-analysis. On this list that is a short set: berberine, fenugreek, alpha-lipoic acid for neuropathy symptoms, and the behavioural interventions — post-meal walking, meal sequencing, resistance training, carbohydrate restriction. Even here the limits are stated by the reviews themselves: the berberine and fenugreek meta-analyses both describe most included trials as low in methodological quality.
- Human trial evidence, mixed or unreplicated. Positive trials exist but are small, old, industry-funded, or contradicted by later work. Cinnamon, chromium, bitter melon and gymnema all sit here: a 2016 review of 11 cinnamon trials found modest effects on fasting glucose and HbA1c; a 2016 review of 20 chromium trials judged the evidence of effectiveness limited; a 2012 Cochrane review found insufficient evidence for bitter melon; and gymnema's best-known human trial (1990) followed 22 patients.
- Mechanism only. Cell-culture or rodent data showing a plausible pathway, with no adequate human glucose trial. Much of the mushroom and polyphenol literature is here. It is genuinely interesting, and it does not show a change in HbA1c in people.
Several entries below name their tier. Where the honest answer is "the evidence does not support this," the page says so rather than omitting the topic — a supplement that does not work is information a reader needs as much as one that does.
Glycemic Index and Glycemic Load
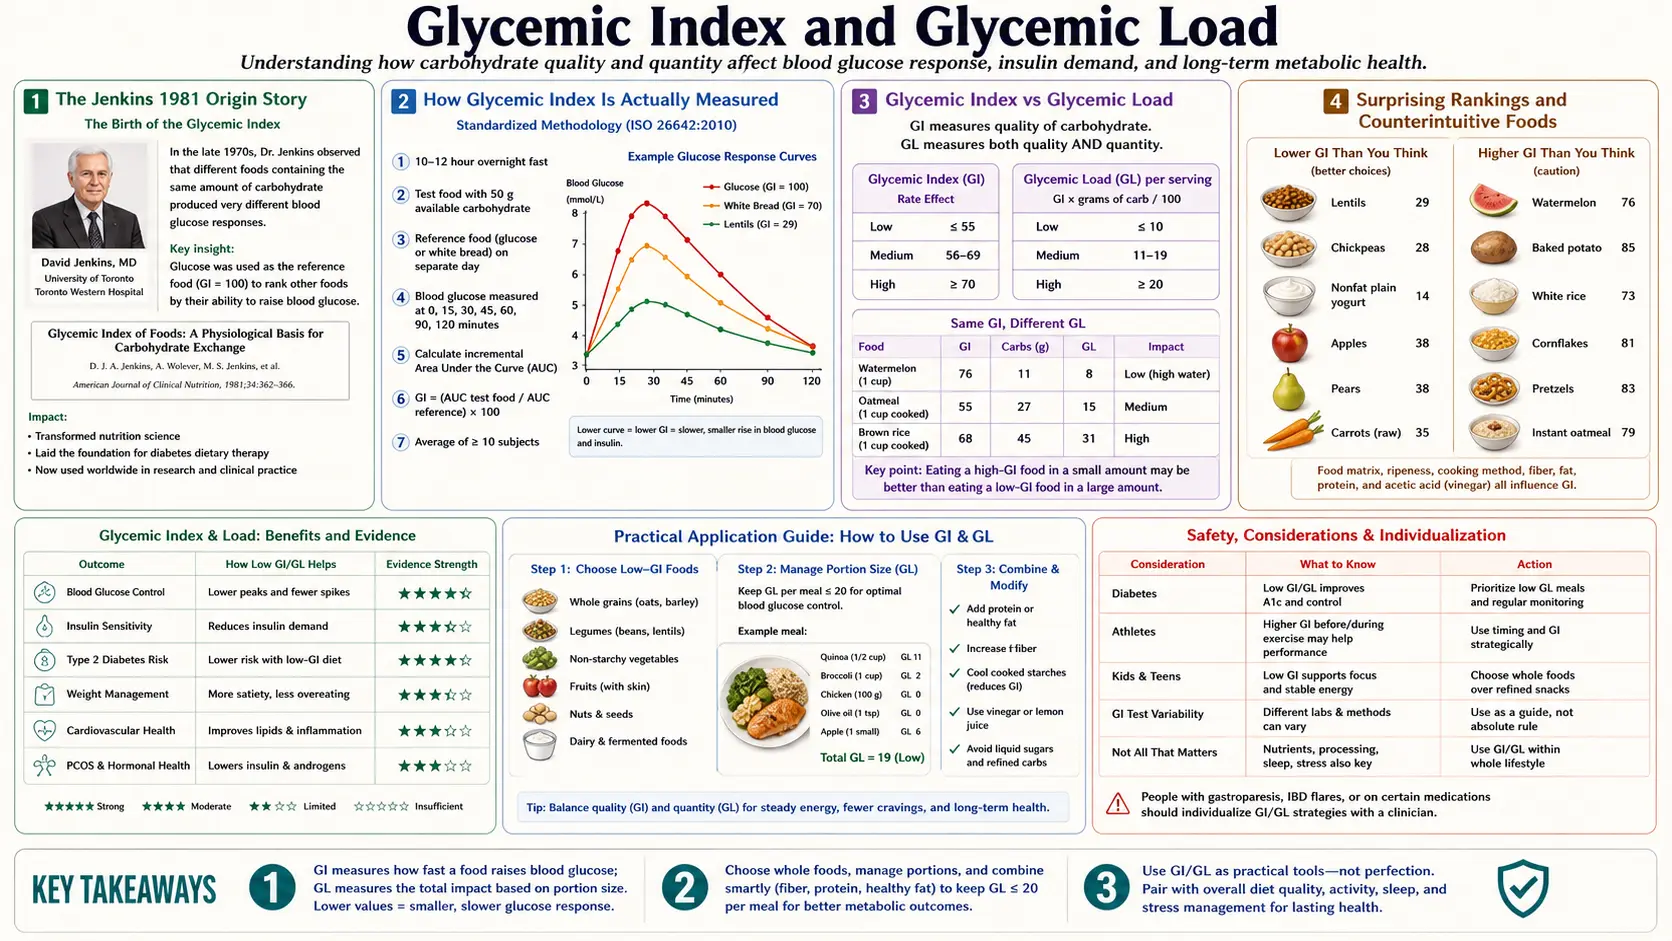
This section is the article that used to live at Blood Sugar → Glycemic Index, kept whole: the Jenkins 1981 methodology, the difference between the index and the load, why some rankings are counterintuitive, and what the clinical outcome evidence actually supports.
The Jenkins 1981 Origin Story
The conventional dietary advice in the 1960s and 1970s divided carbohydrates into "simple" (mono- and disaccharides — glucose, fructose, sucrose, lactose) and "complex" (polysaccharides — starches and fibers), with the assumption that simple carbohydrates would produce rapid glucose spikes and complex carbohydrates would produce slow, gradual rises. This assumption turned out to be physiologically wrong.
David Jenkins and colleagues at the University of Toronto fed 62 commonly eaten foods and sugars individually to groups of 5 to 10 healthy fasting volunteers and measured blood glucose over two hours. The area under each food's glucose response curve was expressed as a percentage of the area after the same amount of carbohydrate taken as glucose (set to 100). The result was the glycemic index.
The findings overturned the simple/complex framework. In the 1981 paper the largest rises came from vegetables (70%) and breakfast cereals (65%), and the smallest from dairy products (35%) and dried legumes (31%). In the averaged values of the 2008 international tables (Atkinson et al.), boiled potato (78) and white wheat bread (75) score higher than sucrose (65), while fructose scores 15. The disconnect was that "complex" refers to molecular structure, while postprandial glucose response depends on how rapidly the digestive system can liberate glucose monomers from the food matrix — a function of starch granule structure, particle size, fat and protein content, fiber content, and pre-existing gelatinization from cooking. The 1981 paper in the American Journal of Clinical Nutrition launched four decades of subsequent epidemiology and clinical trials.
How GI Is Actually Measured
The standardized methodology (ISO 26642:2010), as the University of Sydney GI testing service describes it:
- Test subjects — 10 healthy volunteers per food tested, after an overnight fast.
- Test dose — exactly 50 g of available carbohydrate (total carbohydrate minus fiber) from the test food.
- Reference — the same subjects consume an equal-carbohydrate portion of pure glucose (GI = 100 by definition) on three separate days; some laboratories have used white bread as the reference instead.
- Blood sampling — blood glucose measured repeatedly over two hours (the Sydney service describes eight measurements).
- Calculation — incremental area under the curve (iAUC), with only the area above the fasting baseline counted. The test food iAUC divided by the reference iAUC, multiplied by 100, gives the GI value.
Variability is large. In a 2016 study that tested white bread three times in each of 63 healthy volunteers (Matthan et al.), the mean within-person coefficient of variation was 20% and the between-person one 25%, and the authors concluded that GI values are unlikely to be a good approach to guiding individual food choices. The published GI value is a mean across subjects. This is one source of the criticism that GI is a population average that may not apply to any individual person, covered in the CGM deep-dive.
The reference scale matters. Values on the white-bread scale are higher than on the glucose scale: the 2008 international tables (Atkinson, Foster-Powell and Brand-Miller) list both and convert between them with a factor of 100/70, and the authors state that the glucose scale is recommended for final reporting. Older studies and some consumer guides use the white-bread scale. Mixing reference scales is a common source of confusion.
Glycemic Index vs Glycemic Load
GI tells you how rapidly the carbohydrate in a food converts to blood glucose, ranked against pure glucose. It does not tell you how much carbohydrate is in a typical serving. This is the gap that glycemic load (GL) fills.
The formula:
GL = (GI / 100) × (grams of available carbohydrate per serving)
The canonical illustrative example is watermelon: it has a high GI (76 in the 2008 tables, in the same range as white bread), but a typical serving contains little carbohydrate because the fruit is mostly water, so its GL per serving is low. Boiled potato has a similar GI (78), but a serving carries much more carbohydrate, so its GL is much higher.
Commonly cited GL bands per serving:
- Low GL: 10 or less per serving
- Medium GL: 11-19 per serving
- High GL: 20 or more per serving
Researchers describe GL as closer to the actual glucose response at a typical serving, while GI describes how the food digests. A high-GI food in a small portion produces a modest rise; a low-GI food in a large portion can still produce a large one.
Surprising Rankings and Counterintuitive Foods
Foods that tend to surprise people on first encounter with the GI tables (values from the averaged Table 1 of the 2008 international tables, glucose scale):
- White rice (GI 73) vs sucrose (GI 65) — table sugar scores lower than boiled white rice, because sucrose is half fructose (fructose alone scores 15), which barely raises blood glucose.
- Watermelon (GI 76) vs boiled carrots (GI 39) — carrots are a low-GI food; the 2008 authors note that more reliable data now give carrots a GI of 39.
- Instant oat porridge (GI 79) vs rolled-oat porridge (GI 55) — processing matters. The smaller the particle size, the larger the surface area exposed to digestive enzymes, the faster the glucose release.
- Whole wheat bread (GI 74) vs white wheat bread (GI 75) — bread made from finely milled whole-wheat flour scores almost the same as white bread, so "whole wheat" on a label is not predictive of GI; specialty grain breads average 53.
- Instant mashed potato (GI 87) vs boiled potato (GI 78) — processing that breaks down the potato's structure is associated with a higher GI.
- Lentils (GI 32), chickpeas (28) and kidney beans (24) — intact legumes have a low GI because the seed coat and intact cells slow starch hydrolysis.
- Dates (GI 42) — despite being concentrated dried fruit, raw dates average a low GI in the 2008 tables.
- Brown rice (GI 68) vs white rice (GI 73) — the whole-grain form scores lower, and the 2008 authors note that rice, including whole grain, comes in both high- and low-GI varieties.
What Determines a Food's GI
The factors that drive a carbohydrate-containing food's GI, in approximate order of impact:
- Starch type — amylopectin (branched, easily digested by α-amylase) gives high GI. Amylose (linear, more resistant to enzymatic hydrolysis) gives lower GI. Rice varieties higher in amylose tend to have a lower GI than sticky, low-amylose varieties.
- Particle size and processing — the smaller the particle, the higher the surface area exposed to digestive enzymes. Intact and coarsely ground grains tend to have a lower GI than finely milled flour; whole-meal bread made from fine flour scores close to white bread (74 vs 75 in the 2008 tables).
- Gelatinization — raw starch is partially crystalline and resistant to digestion. Cooking with water at >60°C breaks the crystal structure and exposes glucose units. Over-cooked pasta has higher GI than al dente pasta.
- Fiber content — soluble fiber (beta-glucan in oats, pectin in fruit, glucomannan in konjac) increases viscosity in the gut, slowing gastric emptying and starch hydrolysis. Insoluble fiber (cellulose, wheat bran) has smaller effect on GI but improves transit.
- Fat content — fat slows gastric emptying and blunts the postprandial glucose response. The 1981 Jenkins paper found a significant negative relationship between a food's fat and protein content and its glucose rise.
- Protein content — protein delays gastric emptying and stimulates insulin and incretin release independently of carbohydrate, both of which lower postprandial glucose.
- Acidity — lactic acid (sourdough, yogurt) and acetic acid (vinegar) are proposed to slow gastric emptying and carbohydrate digestion. In small trials, vinegar taken with a starchy meal lowered the post-meal glucose response (Johnston 2005, 2010).
- Ripeness — an under-ripe banana, still rich in resistant starch, is digested more slowly than a ripe one, in which more of the starch has turned to sugars (raw banana averages 51 in the 2008 tables).
- Resistant starch — cooked-and-cooled starches (potato salad, rice cooled overnight then reheated) develop retrograded starch that resists α-amylase, lowering GI.
Food Matrix Effects and Meal Composition
GI is measured for a food eaten in isolation. The number on the GI table corresponds to eating 50 g of available carbohydrate from a single source after an overnight fast. Real meals contain mixtures of foods, and the GI of the mixture is not simply the average of the components.
Key meal-composition effects:
- Fat + carbohydrate — adding fat to a starch consistently lowers postprandial glucose. The mechanism is slowed gastric emptying. A blunted glucose curve is not the same as a low total insulin demand, so the glucose curve alone does not describe a meal's metabolic effect.
- Protein + carbohydrate — protein delays gastric emptying and stimulates insulin and incretin release. In a pilot crossover study of 11 adults with type 2 diabetes (Shukla et al. 2015), eating the protein and vegetables of a meal 15 minutes before the carbohydrate, rather than after it, gave glucose levels 28.6%, 36.7% and 16.8% lower at 30, 60 and 120 minutes.
- Fiber + carbohydrate — soluble fiber from psyllium, oats, or legumes lowers the glucose response when consumed in the same meal.
- Vinegar + carbohydrate — in a 2005 crossover study of 11 healthy adults (Johnston and Buller), vinegar taken with a high-glycemic-load meal reduced the 60-minute glucose response by about 55%. In a 2010 series of four small trials (Johnston et al.), two teaspoons (about 10 g) of vinegar taken at mealtime reduced post-meal glucose by 20% compared with placebo when the meal contained complex carbohydrate, but had no effect with a glucose drink — which the authors took to mean the effect acts on carbohydrate digestion.
- Cinnamon + carbohydrate — cinnamon has been studied mainly as a supplement; a 2016 review of 11 trials in type 2 diabetes found modest effects on fasting glucose and HbA1c (Costello et al.). The Cinnamon page covers it.
The composite effect of "vegetables and protein first, starch last" meal sequencing — covered in the Exercise and Meal Timing deep-dive — lowered post-meal glucose in the Shukla pilot study (figures above) without changing what was eaten, only the order.
Clinical Outcomes Evidence (Diabetes, Cardiovascular, Cancer)
The epidemiologic literature linking low-GI/low-GL diets to better health outcomes is substantial, though not without controversy:
- Type 2 diabetes incidence — the 1997 Salmerón analyses of US women (Nurses' Health Study) and men (Health Professionals Follow-up Study) found higher risk on higher-GI or higher-GL diets: in women, the highest versus lowest GL quintile had a relative risk of 1.47; in men, the highest versus lowest GI quintile had a relative risk of 1.37. A 2019 dose-response meta-analysis (Livesey et al.) found a relative risk of 1.27 per 10 GI units (10 studies) and 1.26 per 80 g/day of GL (15 studies).
- HbA1c reduction in established diabetes — the Brand-Miller 2003 meta-analysis of 14 randomized trials (356 subjects) found low-GI diets reduced HbA1c by 0.43 percentage points more than high-GI diets — an effect the authors described as similar to that of drugs that target post-meal glucose.
- Cardiovascular disease — the Liu 2000 Nurses' Health Study analysis of 75,521 women found a relative risk of coronary heart disease of 1.98 in the highest versus lowest GL quintile, most evident in women with a BMI of 23 or more. The PURE study (Jenkins et al., NEJM 2021; 137,851 participants on five continents) found a high-GI diet associated with a higher risk of a major cardiovascular event or death, with a hazard ratio of 1.51 among participants with pre-existing cardiovascular disease and 1.21 among those without.
- Cancer — the Sieri and Krogh 2017 overview found consistent evidence that high dietary GI is associated with colorectal cancer, and high GL with breast and endometrial cancer, with small-to-moderate risk increases. The main proposed mechanism is chronic hyperinsulinemia and insulin-like growth factor activity.
- Mortality — in PURE, a high GI was also associated with a higher risk of death from cardiovascular causes; for glycemic load, results matched GI among participants with cardiovascular disease but were not significant among those without.
The countervailing evidence: the Matthan 2016 variability study (above) questioned whether GI values can guide individual food choices, and randomized weight-loss trials of diet patterns do not isolate GI — the 2018 DIETFITS trial (609 adults) found no significant difference in 12-month weight change between its "healthy low-fat" and "healthy low-carbohydrate" arms (−5.3 vs −6.0 kg).
Limits and Personalization (Why CGM Beats GI)
The Zeevi 2015 Cell paper from the Weizmann Institute monitored week-long glucose levels in an 800-person cohort, measured responses to 46,898 meals, and found high variability in the response to identical meals. A machine-learning algorithm that combined blood parameters, dietary habits, body measurements, physical activity and gut microbiota predicted personal post-meal responses, was validated in a separate 100-person cohort, and a randomized dietary intervention based on it produced lower post-meal responses.
Published GI tables are population averages that may not apply to any individual person; this is the main argument made for continuous glucose monitoring in people without diabetes — a use whose long-term health benefit has not been established by large outcome trials (see the history section below).
Other limitations of the GI methodology:
- Measured in healthy volunteers rather than in people with diabetes, although the 2008 tables found a correlation of r = 0.94 between values measured in healthy and diabetic subjects for 20 staple foods.
- Within-person variability (a coefficient of variation of about 20% in the Matthan study) means the published GI of any single food is uncertain.
- GI is measured in fasted state; real meals are eaten throughout the day with carryover effects.
- Reference (glucose vs white bread) confusion in the literature.
- Product-to-product variation within a single food category (different breads, different rices) is substantial, and the 2008 authors note that some products appear to be rising in GI over time.
Findings Often Applied Without a CGM
The points most often drawn from this research for people without a CGM, stated as findings:
- GL alongside GI — portion size matters as much as ranking. The University of Sydney online database (glycemicindex.com) is maintained by the group that compiles the international tables.
- Minimally processed forms score lower — in the 2008 tables rolled-oat porridge scores lower than instant oat porridge, brown rice lower than white rice, boiled potato lower than instant mashed potato, boiled sweet potato (63) lower than boiled potato (78), and intact lentils are low-GI.
- Meal sequencing — eating vegetables and protein before starch lowered post-meal glucose in the Shukla pilot study without changing what was eaten.
- Cooked-and-cooled starches — cooling cooked pasta, rice or potatoes forms retrograded (resistant) starch, which resists digestion.
- Fat, protein, fiber or acid with the carbohydrate — combinations such as nuts with fruit, vinegar dressing on a salad before starch, Greek yogurt with berries, or full-fat dairy with cereal lower a meal's glucose response compared with the carbohydrate alone (Jenkins 1981; Johnston 2005).
- Specialty products — a "sugar-free", "gluten-free" or "diabetic" label does not by itself predict GI; the 2008 tables found breads, breakfast cereals and rice products, including whole-grain versions, in both high- and low-GI forms.
- Home testing — some people use a fingerstick meter to look at their own response to a food eaten alone after an overnight fast; a single home reading is not a standardized GI test, which uses 10 subjects and repeated reference tests.
Foods and Dietary Patterns
- Glycemic Index — the Jenkins 1981 framework, and why researchers treat glycemic load as closer to the glucose response at a typical serving.
- Resistant Starches — starch that escapes small-intestinal digestion, feeding the colonic microbiome instead of the bloodstream.
- Mediterranean Diet — a dietary pattern tested for cardiovascular outcomes in large randomized trials.
- Anti-Inflammatory Diet — overlapping substantially with the above, framed around the inflammatory contribution to insulin resistance.
- Coffee and Type 2 Diabetes — one of the most consistent observational findings in nutrition, and the reasons to be careful reading causation into it.
Practices and Protocols
- Exercise and Meal Timing — Tier 1. In Reynolds 2016 (41 adults with type 2 diabetes, crossover), advice to walk 10 minutes after each main meal lowered post-meal glucose more than advice to walk 30 minutes once a day (ratio of geometric means 0.88; 0.78 after the evening meal). Eating vegetables and protein before starch lowered the post-meal rise in a small pilot study. Neither costs anything.
- Exercise — muscle contraction raises glucose uptake independently of insulin, and as that acute effect wears off it is replaced by a rise in muscle insulin sensitivity (Holloszy 2005).
- Fasting — time-restricted eating, early time-restricted feeding, and where the evidence separates a real metabolic effect from simple calorie reduction.
- Continuous Glucose Monitoring — not a remedy but a feedback loop: a way to measure the glucose response to the other items on this page.
Medicinal Mushrooms
Mostly Tier 3. The beta-glucan and polysaccharide fractions have documented effects on glucose handling in rodents, and the human trial base is small.
- Agaricus blazei — Blood Sugar Support — the one with the most direct human insulin resistance data of the group, and it is still a small literature.
- Reishi, Maitake and Chaga — polysaccharide mechanisms, largely preclinical for glucose endpoints.
Pharmaceutical Comparators
Two drug classes appear here because they are the benchmark every botanical on this page is implicitly measured against, and because the hypoglycemia findings below apply when glucose-lowering supplements are combined with glucose-lowering drugs.
- GLP-1 Receptor Agonists — semaglutide, tirzepatide and the incretin class that reset expectations for what glucose and weight intervention can achieve.
- Berberine is the AMPK-activating overlap between the two categories — a plant alkaloid with a metformin-like mechanism, which is why the interaction findings below apply to it.
Measuring Blood Sugar
- Hemoglobin A1C — a 90-day weighted average of glucose exposure. The standard measure, and the one that hides post-meal excursions.
- Fasting Insulin — a test that can show raised insulin before glucose rises; it is not part of routine diabetes screening.
- Fasting Insulin and HOMA-IR Testing — how HOMA-IR is calculated (Matthews 1985) and interpreted.
- CGM for Non-Diabetics — the case for and against wearing a sensor without a diagnosis.
Conditions Downstream of Blood Sugar
- Insulin Resistance — the upstream process, which can be present for years before diagnosis.
- Type 2 Diabetes
- Metabolic Syndrome
- Polycystic Ovary Syndrome
- Gestational Diabetes
- Obesity
- Diabetes — the overview page.
Safety: The Hypoglycemia Interaction
This section collects the main hazard findings. Most of the remedies listed above lower blood glucose to some degree. So does every glucose-lowering medication. The effects can add.
- Insulin and sulfonylureas (glipizide, glyburide, glimepiride) cause low blood sugar on their own, and a glucose-lowering supplement such as berberine, fenugreek, bitter melon, gymnema or cinnamon can add to that effect. A 2003 safety review describes possible additive effects of bitter melon with other glucose-lowering agents (Basch et al.), and in the 1990 gymnema study conventional drug doses were lowered during supplementation. Decisions about medicine doses belong with the prescriber.
- Berberine inhibits drug-metabolising enzymes. In a crossover study in healthy men, berberine 300 mg three times daily for two weeks decreased CYP2D6, CYP2C9 and CYP3A4 activity (midazolam AUC rose 40%; Guo et al. 2012), and in renal-transplant recipients it raised blood levels of ciclosporin (Wu et al. 2005). That is a drug-interaction mechanism, not a nutrition one.
- Bitter melon, pregnancy and children. A 2003 safety review lists reported adverse effects including hypoglycemic coma and convulsions in children, reduced fertility in mice and a favism-like syndrome (Basch et al.); seed and fruit extracts have shown abortifacient activity in animal studies, and there is no good safety data in human pregnancy.
- Cassia cinnamon carries coumarin. Cassia species contain substantial amounts of coumarin, while true (Ceylon) cinnamon bark contains only traces (Wang et al. 2013), and most cinnamon glucose trials used cassia (7 of the 11 in the 2016 review). Coumarin at high intakes is linked to liver toxicity. Covered in Cassia vs Ceylon and Coumarin.
- Hypoglycemia symptoms can fade over the course of diabetes (impaired awareness of hypoglycemia). Hypoglycemia Awareness and Prevention covers what falling awareness looks like and how it is managed.
- Measurement and changes. This is the argument usually made for a glucose meter or a sensor when a supplement is added: without measuring, an interaction shows up as a symptom rather than as a number.
The History of Blood Sugar Medicine
Everything above is the current state of a very old problem. This section is the article that used to live at Blood Sugar — History, kept whole: how diabetes was recognised in the ancient world, how the liver and the pancreas were pinned down in the nineteenth century, and how each measurement that made modern glucose control possible arrived.
Sweet Urine: The Ancient World
Long before anyone could measure a milligram of glucose, physicians recognized the disease we now tie to blood sugar by a single unforgettable clue: urine that was abnormally copious and abnormally sweet. The word diabetes — from a Greek root meaning "to pass through," the sense being that fluids ran straight through the body like a siphon — is usually credited to the Greek physician Aretaeus of Cappadocia, who in roughly the second century CE left a vivid clinical description of the wasting, unquenchable thirst, and relentless urination of the condition. Ancient Indian physicians in the Ayurvedic tradition independently described a disease they called madhumeha ("honey urine"), noting that the urine of affected people attracted ants and flies — a shrewd, low-tech sugar test centuries before chemistry existed.
The Latin epithet mellitus ("honey-sweet") was added much later, and a widely cited account (Karamanou et al. 2016) credits the seventeenth-century English physician Thomas Willis with adding it to describe the extremely sweet taste of diabetic urine — the era when European doctors literally diagnosed the disease by tasting it. It is worth being precise here: these early observers correctly tied the disease to sugar leaving the body, but they had no concept of blood sugar as a regulated quantity, and several of their proposed causes were wrong. What the ancient record reliably gives us is the clinical recognition of the disease and its sweet-urine signature — the question of where the sugar came from would not be answered for another two millennia.
Claude Bernard and the Sugar-Making Liver (1850s)
The modern science of blood sugar begins with one of the towering figures of nineteenth-century physiology, the French experimentalist Claude Bernard (1813–1878). Trained in Paris and a pioneer of controlled animal experimentation, Bernard overturned a deeply held assumption: that animals could only break sugar down, and that any glucose in the body must have come from food. In a series of experiments in the mid-1850s he showed the opposite — that the liver itself manufactures and releases glucose into the blood, even in an animal fed no carbohydrate at all. He called this the liver's "glycogenic" (sugar-forming) function, and in 1857 he isolated the storage carbohydrate the liver uses for the purpose, naming it glycogen — literally "sugar-former," the "animal starch" that the liver builds up when blood sugar is high and breaks back down to glucose when it falls.
This was the conceptual birth of blood-sugar regulation as we now understand it: a quantity actively held within a range, not a passive leftover of digestion. Bernard generalized the insight into one of the most important ideas in all of physiology — the milieu intérieur, the "internal environment" whose constancy the body works to maintain. That idea, later refined and renamed homeostasis by the American physiologist Walter Cannon in the twentieth century, is the intellectual frame inside which every later discovery about glucose sits. Bernard did not discover insulin or explain diabetes, and some of his specific mechanistic claims were later corrected; his enduring contribution was to establish that the body keeps blood sugar steady on purpose, and that the liver is a central player in doing so.
The Pancreas Pinned Down (1889)
If Bernard showed that blood sugar is regulated, the next question was what organ governs it — and the answer arrived almost by accident. In 1889, at the University of Strasbourg, two researchers, Oskar Minkowski (1858–1931) and Joseph von Mering (1849–1908), were investigating the role of the pancreas in fat digestion. They surgically removed the entire pancreas from a dog. Within a short time the previously healthy animal developed the classic signs of severe diabetes: it drank and urinated enormously, and — in the detail that made history — its urine was loaded with sugar . The observation is often retold with the laboratory caretaker noticing that flies swarmed the dog's urine, prompting Minkowski to test it.
Minkowski repeated the experiment carefully and confirmed it: removing the pancreas reliably produced diabetes. Crucially, he then showed that if a small piece of pancreas was grafted back under the dog's skin, the diabetes was held off until that graft was removed — powerful evidence that the pancreas was releasing some internal substance into the blood that controlled sugar, rather than acting only through its digestive juices. This pointed straight at the small clusters of pancreatic cells that the German anatomy student Paul Langerhans had described in 1869 (the "islets of Langerhans") without knowing their function. The pancreas was now the prime suspect; the hunt was on for the hormone it made. That hunt would take another three decades and would end in Toronto.
Insulin: The Toronto Breakthrough (1921–1922)
The single most consequential event in the history of blood sugar is the isolation of insulin — the pancreatic hormone that lowers blood glucose — at the University of Toronto in 1921 and its first successful use in a patient in 1922. Before insulin, a diagnosis of what we now call type 1 diabetes was effectively a death sentence; the only treatment was a brutal near-starvation diet that bought, at most, a little time. The breakthrough came from an unlikely team. Frederick Banting (1891–1941) was a young Canadian surgeon with an idea but no track record in research. Charles Best (1899–1978) was a medical student assigned as his assistant. They worked in the laboratory of the Scottish-born physiologist John Macleod (1876–1935), who provided the facilities, expertise, and direction, and the biochemist James Collip (1892–1965) developed the methods to purify the extract enough to inject safely into humans.
Over the summer of 1921 Banting and Best produced pancreatic extracts that lowered blood sugar in diabetic dogs. With Collip's purification, the extract was ready for a human trial. In January 1922, a 14-year-old boy named Leonard Thompson, dying of diabetes in Toronto General Hospital, became the first person treated with insulin. The first, less-pure dose produced an allergic reaction and little benefit; a refined batch given days later dramatically lowered his blood sugar and reversed his decline. Word spread fast, and within little more than a year insulin — manufactured at scale in partnership with a US drug manufacturer — was saving lives around the world. The 1923 Nobel Prize in Physiology or Medicine went to Banting and Macleod; in a gesture that also reflected real bitterness over who deserved credit, Banting shared his prize money with Best and Macleod shared his with Collip. The discovery did not cure diabetes — insulin must be taken for life — but it transformed an acute killer into a chronic condition that could be managed, and it made "controlling blood sugar" a daily, lifelong, achievable task for millions.
From French Lilac to Metformin (1920s–1957)
Insulin solved the crisis of type 1 diabetes, but the far more common type 2 — in which the body still makes insulin but responds to it poorly — needed different tools, and one of the most important has a genuinely old botanical origin. The plant Galega officinalis, known as goat's rue or French lilac, was used in European folk and herbal medicine for symptoms we would now recognize as diabetes; it was eventually found to be rich in guanidine and related compounds that lower blood glucose. Guanidine itself proved too toxic for routine use, but chemists in the early twentieth century synthesized a family of safer derivatives, the biguanides. One of them, dimethylbiguanide, is the drug we now call metformin.
Metformin's clinical career was launched by the French physician Jean Sterne (1909–1997), who in collaboration with colleagues studied the compound and published results supporting its use in diabetes in 1957; he gave it a trade name meaning "glucose eater." Metformin spread through Europe and was eventually approved in the United States in 1994. Today it is one of the most widely prescribed medicines on earth and long the standard first-line drug for type 2 diabetes, working largely by reducing the liver's output of glucose — the very organ whose sugar-making role Claude Bernard had identified a century earlier. The lineage from a medieval herb to a modern first-line drug is a clean example of how blood-sugar treatment has repeatedly moved from folk observation to isolated compound to rigorously tested medicine.
Measuring the Average: HbA1c (1968)
For most of the twentieth century, a blood-sugar reading was a snapshot — a single value that could be high or low depending on the last meal, the time of day, or stress. What was missing was a way to measure long-term control. That gap was closed by the Iranian-born physician and biochemist Samuel Rahbar (1929–2012). In 1968, while screening blood samples by electrophoresis, Rahbar noticed an unusual fast-moving hemoglobin fraction that appeared consistently and at elevated levels in the blood of people with diabetes. He confirmed the pattern in further diabetic patients and recognized that this was a form of hemoglobin chemically modified by glucose — what we now call glycated hemoglobin, or HbA1c.
The insight that made HbA1c revolutionary is simple and elegant: because glucose attaches to hemoglobin slowly and irreversibly over the lifetime of a red blood cell (about three months), the percentage of hemoglobin that is glycated reflects the average blood sugar over roughly the preceding 8–12 weeks. A single HbA1c test, in other words, summarizes months of glucose exposure in one number that no single fingerstick can fake. It took years for the field to accept the finding — many assumed an enzyme must be responsible — but HbA1c eventually became the central yardstick of diabetes care, the metric used to diagnose the disease, to judge whether treatment is working, and (as later research showed) to predict the risk of long-term complications. The companion Hemoglobin A1C page covers the test in clinical detail.
Ranking the Foods: The Glycemic Index (1981)
Blood sugar is shaped not only by hormones and drugs but by food — and for a long time nutrition advice lumped all carbohydrates together, distinguishing only crudely between "simple" sugars and "complex" starches. That framework was upended in 1981 when David J. A. Jenkins and colleagues at the University of Toronto published the glycemic index in the American Journal of Clinical Nutrition. Jenkins's team fed healthy volunteers fixed amounts of carbohydrate from 62 different foods and measured the actual rise in blood glucose each produced over two hours, expressing it as a percentage of the response to pure glucose. The results overturned conventional wisdom: some starchy "complex" foods spiked blood sugar more than table sugar did, while legumes produced surprisingly gentle rises.
The glycemic index gave clinicians and patients, for the first time, an evidence-based way to rank foods by their real-world effect on blood sugar rather than by their chemical category. It was later refined with the concept of glycemic load (which accounts for how much carbohydrate a normal serving actually contains, not just how fast it is absorbed), and it remains a practical tool wherever continuous monitoring is unavailable. The history here is honest in both directions: the glycemic index was a genuine advance and is well validated as a measurement, but its usefulness for predicting long-term health outcomes in the general population is more debated than its popularity suggests, because real meals mix foods and individual responses vary. The Glycemic Index & Load section above treats the nuances.
Insulin Resistance and "Syndrome X" (1988)
By the late twentieth century it was clear that the most common blood-sugar problem in the developed world was not a shortage of insulin but a blunted response to it — insulin resistance. The idea that tissues could resist insulin had been raised decades earlier (the British physician Harold Himsworth distinguished "insulin-sensitive" from "insulin-insensitive" diabetes in the 1930s), but its central importance was crystallized by the Stanford endocrinologist Gerald Reaven (1928–2018). In his 1988 Banting Lecture to the American Diabetes Association, Reaven proposed that insulin resistance was not merely one feature of type 2 diabetes but the common thread linking a whole cluster of disorders — high blood sugar, high blood pressure, abnormal blood fats, and elevated cardiovascular risk. He named the cluster "Syndrome X."
The framework reshaped how medicine thinks about blood sugar. It shifted attention upstream, from glucose itself to the hormonal dysfunction driving it, and it explained why high blood sugar so often travels with heart disease, obesity, and stroke. The cluster Reaven described is now usually called the metabolic syndrome, and insulin resistance is understood to precede overt type 2 diabetes by many years — which is precisely why measuring and addressing it early has become a goal of preventive medicine. The Insulin Resistance deep-dive and the Metabolic Syndrome page carry this thread forward.
Proving Control Matters: DCCT and UKPDS (1993–1998)
It is one thing to say blood sugar should be controlled; it is another to prove, in a rigorous trial, that tighter control actually prevents the blindness, kidney failure, nerve damage, and amputations that diabetes causes. Two landmark studies settled the question. The Diabetes Control and Complications Trial (DCCT), published in the New England Journal of Medicine in 1993, followed 1,441 people with type 1 diabetes and compared intensive blood-sugar control against the conventional standard of the day. The result was decisive: intensive control (lower average HbA1c) cut the development and progression of diabetic eye, kidney, and nerve disease by large margins — in participants without retinopathy at the start, the risk of developing it fell by 76 percent. The trade-off, honestly reported, was a two-to-threefold increase in severe hypoglycemia.
What DCCT did for type 1, the United Kingdom Prospective Diabetes Study (UKPDS) did for the far more common type 2. Published in The Lancet in 1998 after following 3,867 newly diagnosed patients for ten years, UKPDS showed that intensive blood-glucose control substantially reduced microvascular complications in type 2 diabetes (a 25 percent risk reduction in microvascular endpoints) — though, importantly, it did not significantly reduce heart attacks and strokes within the trial period, and it too increased the risk of hypoglycemia. Together these two trials are the evidentiary bedrock of modern diabetes care: they are why HbA1c targets exist, why "tight control" is recommended, and also why that recommendation is tempered by honesty about its limits and its risks. They are the moment blood-sugar management stopped being a plausible idea and became a proven one.
The Measurement Revolution: Continuous Glucose Monitoring
For most of this history, a person could only know their blood sugar by drawing blood. The home glucose meter, which let patients test a fingertip drop themselves, spread in the 1970s and 1980s and was itself a revolution in self-management. But a fingerstick is still a single snapshot, and it tells you nothing about what happens between tests — the overnight lows, the post-meal spikes, the slow drift before breakfast. The technology that closed that gap traces back to the American chemist Leland Clark, whose work on enzyme-based electrochemical glucose sensing in the 1960s underlies essentially every modern sensor: an enzyme (glucose oxidase) reacts with glucose and generates a tiny electrical signal proportional to its concentration.
Decades of engineering turned that principle into a wearable. The first commercial continuous glucose monitor (CGM) — a small sensor worn under the skin that reads glucose in the interstitial fluid every few minutes — was approved by the U.S. Food and Drug Administration in 1999, initially as a professional tool that stored data for a clinician to review later. From there the devices improved relentlessly: real-time displays, longer wear time, factory calibration, and direct streaming to a phone. Modern systems let a person watch their own glucose curve in real time and learn, meal by meal, exactly how their body responds. This is the development that finally made the abstract goal of "blood-sugar management" into something an ordinary person can see, measure, and act on day to day; the Continuous Glucose Monitoring deep-dive covers the current devices and their limits.
Evidence & Reception: What Is Actually Established
Because "blood sugar management" spans everything from life-saving medicine to popular wellness advice, honesty requires separating what is firmly established from what is promising or merely marketed. The following are well established by strong evidence: that blood glucose is actively regulated, with the liver and the pancreatic hormone insulin at the center; that insulin replacement is essential and life-saving in type 1 diabetes; that metformin is a safe, effective first-line drug for type 2 diabetes; that HbA1c reliably reflects long-term glucose exposure; and that, as the DCCT and UKPDS trials proved, sustained control of blood sugar reduces the microvascular complications of diabetes (eye, kidney, and nerve damage). These are not in serious scientific dispute.
Other widely promoted ideas are genuine but more limited or more debated than popular sources imply. Intensive glucose lowering has a clearer benefit for small-vessel complications than for heart attacks and strokes, and pushing blood sugar too low carries real danger from hypoglycemia — the benefit-versus-risk balance is individual, not one-size-fits-all. The glycemic index is a valid measurement but an imperfect guide to whole-diet health. And the fast-growing practice of using continuous glucose monitors in people without diabetes — now heavily marketed for "metabolic optimization" is an area where enthusiasm currently outruns the evidence: it is plausible and increasingly studied, but the long-term health benefit of CGM-guided eating in healthy adults is not yet established by large outcome trials. Finally, the many herbs, foods, and supplements promoted for blood sugar (cinnamon, berberine, chromium, bitter melon, and others) range from modestly supported to weak; some show real but small effects in trials, and none is a substitute for proven care.
The honest bottom line is that blood-sugar management is one of the best-validated areas in all of medicine at its core — insulin, metformin, HbA1c, and the case for control are bedrock — while its newer, consumer-facing fringes (non-diabetic CGM, supplement claims, and aggressive "optimization") are exactly the parts that demand the most skepticism. Decisions about medication, targets, and monitoring in diabetes or prediabetes belong with a clinician, because the right level of blood-sugar control is a balance that depends on the individual.
Key Research Papers
Every DOI below was verified against Crossref and the abstract read for support before it was listed. Deeper, topic-specific reference lists live on the individual pages linked above.
- Reaven GM. Banting Lecture 1988: Role of Insulin Resistance in Human Disease. Diabetes, 1988;37(12):1595–1607 — doi:10.2337/diab.37.12.1595 — The lecture that named the syndrome and reframed hyperglycemia as a downstream symptom.
- Jenkins DJ, Wolever TM, Taylor RH, et al. Glycemic index of foods: a physiological basis for carbohydrate exchange. The American Journal of Clinical Nutrition, 1981;34(3):362–366 — doi:10.1093/ajcn/34.3.362 — The original glycemic index paper (62 foods, groups of 5 to 10 healthy volunteers).
- Selvin E, Steffes MW, Zhu H, et al. Glycated Hemoglobin, Diabetes, and Cardiovascular Risk in Nondiabetic Adults. New England Journal of Medicine, 2010;362(9):800–811 — doi:10.1056/NEJMoa0908359 — The ARIC analysis showing risk rises continuously below the diabetic threshold.
- Yin J, Xing H, Ye J. Efficacy of berberine in patients with type 2 diabetes mellitus. Metabolism, 2008;57(5):712–717 — doi:10.1016/j.metabol.2008.01.013 — A pilot study; its first arm randomised 36 adults with newly diagnosed type 2 diabetes to berberine or metformin (0.5 g three times daily) for 3 months.
- Neelakantan N, Narayanan M, de Souza RJ, van Dam RM. Effect of fenugreek (Trigonella foenum-graecum L.) intake on glycemia: a meta-analysis of clinical trials. Nutrition Journal, 2014;13:7. — doi:10.1186/1475-2891-13-7
- Ooi CP, Yassin Z, Hamid TA. Momordica charantia for type 2 diabetes mellitus. Cochrane Database of Systematic Reviews, 2012;(8):CD007845 — doi:10.1002/14651858.CD007845.pub3 — The review that found the bitter melon evidence insufficient.
- Costello RB, Dwyer JT, Saldanha L, et al. Do Cinnamon Supplements Have a Role in Glycemic Control in Type 2 Diabetes? A Narrative Review. Journal of the Academy of Nutrition and Dietetics, 2016;116(11):1794–1802. — doi:10.1016/j.jand.2016.07.015
- Costello RB, Dwyer JT, Merkel JM. Chromium supplements for glycemic control in type 2 diabetes: limited evidence of effectiveness. Nutrition Reviews, 2016;74(7):455–468. — doi:10.1093/nutrit/nuw011
- Anderson RA, Cheng N, Bryden NA, et al. Elevated Intakes of Supplemental Chromium Improve Glucose and Insulin Variables in Individuals With Type 2 Diabetes. Diabetes, 1997;46(11):1786–1791 — doi:10.2337/diab.46.11.1786 — The positive trial that the review above did not confirm.
- Baskaran K, Kizar Ahamath B, Radha Shanmugasundaram K, Shanmugasundaram ER. Antidiabetic effect of a leaf extract from Gymnema sylvestre in non-insulin-dependent diabetes mellitus patients. Journal of Ethnopharmacology, 1990;30(3):295–300. — doi:10.1016/0378-8741(90)90108-6
- Ziegler D, Ametov A, Barinov A, et al. Oral Treatment With α-Lipoic Acid Improves Symptomatic Diabetic Polyneuropathy: the SYDNEY 2 trial. Diabetes Care, 2006;29(11):2365–2370. — doi:10.2337/dc06-1216
- Reynolds AN, Mann JI, Williams S, Venn BJ. Advice to walk after meals is more effective for lowering postprandial glycaemia in type 2 diabetes mellitus than advice that does not specify timing. Diabetologia, 2016;59(12):2572–2578. — doi:10.1007/s00125-016-4085-2
- Battelino T, Danne T, Bergenstal RM, et al. Clinical Targets for Continuous Glucose Monitoring Data Interpretation: Recommendations From the International Consensus on Time in Range. Diabetes Care, 2019;42(8):1593–1603. — doi:10.2337/dci19-0028
- Dong H, Wang N, Zhao L, Lu F. Berberine in the treatment of type 2 diabetes mellitus: a systemic review and meta-analysis. Evidence-Based Complementary and Alternative Medicine, 2012;2012:591654. — PubMed PMID: 23118793
- Guo Y, Chen Y, Tan ZR, Klaassen CD, Zhou HH. Repeated administration of berberine inhibits cytochromes P450 in humans. European Journal of Clinical Pharmacology, 2012;68(2):213–217. — PubMed PMID: 21870106
- Wu X, Li Q, Xin H, Yu A, Zhong M. Effects of berberine on the blood concentration of cyclosporin A in renal transplanted recipients: clinical and pharmacokinetic study. European Journal of Clinical Pharmacology, 2005;61(8):567–572. — PubMed PMID: 16133554
- Basch E, Gabardi S, Ulbricht C. Bitter melon (Momordica charantia): a review of efficacy and safety. American Journal of Health-System Pharmacy, 2003;60(4):356–359. — PubMed PMID: 12625217
- Wang YH, Avula B, Nanayakkara NP, Zhao J, Khan IA. Cassia cinnamon as a source of coumarin in cinnamon-flavored food and food supplements in the United States. Journal of Agricultural and Food Chemistry, 2013;61(18):4470–4476. — PubMed PMID: 23627682
- Johnston CS, Steplewska I, Long CA, Harris LN, Ryals RH. Examination of the antiglycemic properties of vinegar in healthy adults. Annals of Nutrition and Metabolism, 2010;56(1):74–79. — PubMed PMID: 20068289
- Matthan NR, Ausman LM, Meng H, Tighiouart H, Lichtenstein AH. Estimating the reliability of glycemic index values and potential sources of methodological and biological variability. American Journal of Clinical Nutrition, 2016;104(4):1004–1013. — PubMed PMID: 27604773
- Gardner CD, Trepanowski JF, Del Gobbo LC, et al. Effect of Low-Fat vs Low-Carbohydrate Diet on 12-Month Weight Loss in Overweight Adults and the Association With Genotype Pattern or Insulin Secretion: The DIETFITS Randomized Clinical Trial. JAMA, 2018;319(7):667–679. — PubMed PMID: 29466592
- Karamanou M, Protogerou A, Tsoucalas G, Androutsos G, Poulakou-Rebelakou E. Milestones in the history of diabetes mellitus: The main contributors. World Journal of Diabetes, 2016;7(1):1–7. — PubMed PMID: 26788261
PubMed Topic Searches
- PubMed: Berberine and glycemic control
- PubMed: Fenugreek and glycemia
- PubMed: Bitter melon and type 2 diabetes
- PubMed: Cinnamon and HbA1c
- PubMed: Gymnema sylvestre and blood glucose
- PubMed: Post-meal walking and glucose
- PubMed: Meal sequencing and postprandial glucose
- PubMed: Magnesium and insulin resistance
- PubMed: Myo-inositol and PCOS
- PubMed: CGM and time in range
- PubMed: Alpha-lipoic acid and neuropathy
- PubMed: Time-restricted eating and glucose
Research Papers: Glycemic Index & Load
- Jenkins DJ et al. (1981). Glycemic index of foods: a physiological basis for carbohydrate exchange. Am J Clin Nutr. — PubMed PMID: 6259925
- Salmeron J et al. (1997). Dietary fiber, glycemic load, and risk of NIDDM in men. Diabetes Care. — PubMed PMID: 9096978
- Liu S et al. (2000). A prospective study of dietary glycemic load, carbohydrate intake, and risk of coronary heart disease in US women. Am J Clin Nutr. — PubMed PMID: 10837285
- Atkinson FS, Foster-Powell K, Brand-Miller JC (2008). International tables of glycemic index and glycemic load values: 2008. Diabetes Care. — PubMed PMID: 18835944
- Brand-Miller J et al. (2003). Low-glycemic index diets in the management of diabetes: a meta-analysis. Diabetes Care. — PubMed PMID: 12882846
- Augustin LSA et al. (2015). Glycemic index, glycemic load and glycemic response: an International Scientific Consensus Summit. Nutr Metab Cardiovasc Dis. — PubMed PMID: 26160327
- Livesey G et al. (2019). Dietary glycemic index and load and the risk of type 2 diabetes: a systematic review and updated meta-analyses of prospective cohort studies. Nutrients. — PubMed PMID: 31195724
- Vega-Lopez S et al. (2018). Relevance of the glycemic index and glycemic load for body weight, diabetes, and cardiovascular disease. Nutrients. — PubMed PMID: 30249012
- Sieri S, Krogh V (2017). Dietary glycemic index, glycemic load and cancer: An overview of the literature. Nutr Metab Cardiovasc Dis. — PubMed PMID: 27986350
- Jenkins DJA et al. (2021). Glycemic index, glycemic load, and cardiovascular disease and mortality. NEJM. — PubMed PMID: 33626252
Research Papers: Insulin Resistance
- Reaven GM (1988). Role of insulin resistance in human disease. Banting Lecture. Diabetes. — PubMed PMID: 3056758
- Matthews DR et al. (1985). Homeostasis model assessment: insulin resistance and beta-cell function from fasting plasma glucose and insulin concentrations in man. Diabetologia. — PubMed PMID: 3899825
- DeFronzo RA, Tobin JD, Andres R (1979). Glucose clamp technique: a method for quantifying insulin secretion and resistance. Am J Physiol. — PubMed PMID: 382871
- Petersen KF, Shulman GI (2006). Etiology of insulin resistance. Am J Med. — PubMed PMID: 16563942
- Samuel VT, Shulman GI (2018). Nonalcoholic fatty liver disease as a nexus of metabolic and hepatic diseases. Cell Metab. — PubMed PMID: 28867301
- Stanhope KL et al. (2009). Consuming fructose-sweetened, not glucose-sweetened, beverages increases visceral adiposity and lipids and decreases insulin sensitivity in overweight/obese humans. J Clin Invest. — PubMed PMID: 19381015
- Taylor R, Holman RR (2015). Normal weight individuals who develop type 2 diabetes: the personal fat threshold. Clin Sci (Lond). — PubMed PMID: 25515001
- Taylor R et al. (2018). Remission of human type 2 diabetes requires decrease in liver and pancreas fat content but is dependent upon capacity for beta cell recovery. Cell Metab. — PubMed PMID: 30078554
- Lean ME et al. (2018). Primary care-led weight management for remission of type 2 diabetes (DiRECT): an open-label, cluster-randomised trial. Lancet. — PubMed PMID: 29221645
- Hallberg SJ et al. (2018). Effectiveness and safety of a novel care model for the management of type 2 diabetes at 1 year: an open-label, non-randomized, controlled study. Diabetes Ther. — PubMed PMID: 29417495
Research Papers: Continuous Glucose Monitoring
- Battelino T et al. (2019). Clinical targets for continuous glucose monitoring data interpretation: recommendations from the international consensus on time in range. Diabetes Care. — PubMed PMID: 31177185
- Beck RW et al. (2019). Validation of time in range as an outcome measure for diabetes clinical trials. Diabetes Care. — PubMed PMID: 30352896
- Lu J et al. (2018). Association of time in range, as assessed by continuous glucose monitoring, with diabetic retinopathy in type 2 diabetes. Diabetes Care. — PubMed PMID: 30201847
- Hall H et al. (2018). Glucotypes reveal new patterns of glucose dysregulation. PLoS Biol. — PubMed PMID: 30040822
- Zeevi D et al. (2015). Personalized nutrition by prediction of glycemic responses. Cell. — PubMed PMID: 26590418
- Beck RW et al. (2017). Effect of continuous glucose monitoring on glycemic control in adults with type 1 diabetes using insulin injections: the DIAMOND randomized clinical trial. JAMA. — PubMed PMID: 28118453
- Martens T et al. (2021). Effect of continuous glucose monitoring on glycemic control in patients with type 2 diabetes treated with basal insulin: a randomized clinical trial (MOBILE). JAMA. — PubMed PMID: 34077499
- Wright EE Jr et al. (2021). Use of flash continuous glucose monitoring is associated with A1c reduction in people with type 2 diabetes treated with basal insulin or noninsulin therapy. Diabetes Spectr. — PubMed PMID: 34149259
- Reddy M et al. (2018). A randomized controlled pilot study of continuous glucose monitoring and flash glucose monitoring in people with type 1 diabetes and impaired awareness of hypoglycaemia. Diabet Med. — PubMed PMID: 29230878
- Klonoff DC et al. (2023). The need for accuracy in continuous glucose monitoring: MARD performance characteristics. J Diabetes Sci Technol. — PubMed: MARD accuracy (editorial note: no PubMed record with this title was found on 2026-10-13; the entry is unverified)
Research Papers: Exercise & Meal Timing
- Reynolds AN et al. (2016). Advice to walk after meals is more effective for lowering postprandial glycaemia in type 2 diabetes mellitus than advice that does not specify timing: a randomised crossover study. Diabetologia. — PubMed PMID: 27747394
- Buffey AJ et al. (2022). The acute effects of interrupting prolonged sitting time in adults with standing and light-intensity walking on biomarkers of cardiometabolic health: a systematic review and meta-analysis. Sports Med. — PubMed PMID: 35147898
- Shukla AP et al. (2015). Food order has a significant impact on postprandial glucose and insulin levels. Diabetes Care. — PubMed PMID: 26106234
- Imai S et al. (2011). A simple meal plan of 'eating vegetables before carbohydrate' was more effective for achieving glycemic control than an exchange-based meal plan in Japanese patients with type 2 diabetes. Asia Pac J Clin Nutr. — PubMed PMID: 21669583
- Sutton EF et al. (2018). Early time-restricted feeding improves insulin sensitivity, blood pressure, and oxidative stress even without weight loss in men with prediabetes. Cell Metab. — PubMed PMID: 29754952
- Jamshed H et al. (2019). Early time-restricted feeding improves 24-hour glucose levels and affects markers of the circadian clock, aging, and autophagy in humans. Nutrients. — PubMed PMID: 31151228
- Holloszy JO (2005). Exercise-induced increase in muscle insulin sensitivity. J Appl Physiol. — PubMed PMID: 16036907
- Sigal RJ et al. (2007). Effects of aerobic training, resistance training, or both on glycemic control in type 2 diabetes: a randomized trial. Ann Intern Med. — PubMed PMID: 17876019
- DiPietro L et al. (2013). Three 15-min bouts of moderate postmeal walking significantly improves 24-h glycemic control in older people at risk for impaired glucose tolerance. Diabetes Care. — PubMed PMID: 23761134
- Hawley JA, Lessard SJ (2008). Exercise training-induced improvements in insulin action. Acta Physiol (Oxf). — PubMed PMID: 18171435
Research Papers: Cross-Cutting (Mortality, Complications, Mechanism)
- Selvin E et al. (2010). Glycated hemoglobin, diabetes, and cardiovascular risk in nondiabetic adults. NEJM. — PubMed PMID: 20200384
- Stratton IM et al. (2000). Association of glycaemia with macrovascular and microvascular complications of type 2 diabetes (UKPDS 35). BMJ. — PubMed PMID: 10938048
- DCCT Research Group (1993). The effect of intensive treatment of diabetes on the development and progression of long-term complications in insulin-dependent diabetes mellitus. NEJM. — PubMed PMID: 8366922
- Brownlee M (2005). The pathobiology of diabetic complications: a unifying mechanism. Diabetes. — PubMed PMID: 15919781
- Ceriello A et al. (2008). Oscillating glucose is more deleterious to endothelial function and oxidative stress than mean glucose in normal and type 2 diabetic patients. Diabetes. — PubMed PMID: 18299315
- Monnier L et al. (2006). Activation of oxidative stress by acute glucose fluctuations compared with sustained chronic hyperglycemia in patients with type 2 diabetes. JAMA. — PubMed PMID: 16609090
- Crane PK et al. (2013). Glucose levels and risk of dementia. NEJM. — PubMed PMID: 23924004
- Knowler WC et al. (Diabetes Prevention Program Research Group, 2002). Reduction in the incidence of type 2 diabetes with lifestyle intervention or metformin. NEJM. — PubMed PMID: 11832527
- Tuomilehto J et al. (Finnish Diabetes Prevention Study Group, 2001). Prevention of type 2 diabetes mellitus by changes in lifestyle among subjects with impaired glucose tolerance. NEJM. — PubMed PMID: 11333990
- Lim EL et al. (2011). Reversal of type 2 diabetes: normalisation of beta cell function in association with decreased pancreas and liver triacylglycerol. Diabetologia. — PubMed PMID: 21656330
Research Papers: History of Blood Sugar Medicine
The list below combines key primary and historical papers in the science of blood-sugar regulation with curated PubMed topic-search links. Foundational nineteenth-century work (Claude Bernard's isolation of glycogen; the 1889 Minkowski–von Mering pancreatectomy) is described in the article as historical milestones. Author names, titles, and journals are given as plain text; only the stable DOI, PMID, or archive link is hyperlinked, and each opens in a new tab.
- The Diabetes Control and Complications Trial Research Group. The effect of intensive treatment of diabetes on the development and progression of long-term complications in insulin-dependent diabetes mellitus. New England Journal of Medicine. 1993;329(14):977-986. — doi:10.1056/NEJM199309303291401 · PubMed PMID: 8366922
- UK Prospective Diabetes Study (UKPDS) Group. Intensive blood-glucose control with sulphonylureas or insulin compared with conventional treatment and risk of complications in patients with type 2 diabetes (UKPDS 33). The Lancet. 1998;352(9131):837-853. — PubMed PMID: 9742976
- Reaven GM. Banting Lecture 1988. Role of insulin resistance in human disease. Diabetes. 1988;37(12):1595-1607. — doi:10.2337/diab.37.12.1595 · PubMed PMID: 3056758
- Jenkins DJ, Wolever TM, Taylor RH, et al. Glycemic index of foods: a physiological basis for carbohydrate exchange. American Journal of Clinical Nutrition. 1981;34(3):362-366. — PubMed PMID: 6259925
- Selvin E, Steffes MW, Zhu H, et al. Glycated hemoglobin, diabetes, and cardiovascular risk in nondiabetic adults. New England Journal of Medicine. 2010;362(9):800-811. — doi:10.1056/NEJMoa0908359 · PubMed PMID: 20200384
- Azizi MH, Bahadori M, Azizi F. Breakthrough discovery of HbA1c by Professor Samuel Rahbar in 1968. Archives of Iranian Medicine. 2013;16(12):743-745. — PubMed PMID: 24329151
- History of blood glucose regulation, insulin discovery, and diabetes PubMed: history of insulin and blood-glucose regulation
- Continuous glucose monitoring — history and clinical use PubMed: continuous glucose monitoring
External Authoritative Resources
- The Nobel Prize in Physiology or Medicine 1923 (Banting & Macleod) — NobelPrize.org
- NIDDK (National Institute of Diabetes and Digestive and Kidney Diseases) — Diabetes
- PubMed — Blood-glucose regulation, history and science
Research Papers: Glycemic Index and Load
- Jenkins DJ et al. (1981). Glycemic index of foods: a physiological basis for carbohydrate exchange. American Journal of Clinical Nutrition. — PubMed PMID: 6259925
- Atkinson FS, Foster-Powell K, Brand-Miller JC (2008). International tables of glycemic index and glycemic load values: 2008. Diabetes Care. — PubMed PMID: 18835944
- Salmeron J et al. (1997). Dietary fiber, glycemic load, and risk of non-insulin-dependent diabetes mellitus in women. JAMA. — PubMed PMID: 9020271
- Brand-Miller J et al. (2003). Low-glycemic index diets in the management of diabetes: a meta-analysis. Diabetes Care. — PubMed PMID: 12882846
- Augustin LSA et al. (2015). Glycemic index, glycemic load and glycemic response: an International Scientific Consensus Summit. Nutr Metab Cardiovasc Dis. — PubMed PMID: 26160327
- Zeevi D et al. (2015). Personalized nutrition by prediction of glycemic responses. Cell. — PubMed PMID: 26590418
- Livesey G et al. (2019). Dietary glycemic index and load and risk of type 2 diabetes: assessment of causal relations. Nutrients. — PubMed PMID: 31242690
- Jenkins DJA et al. (2021). Glycemic index, glycemic load, and cardiovascular disease and mortality (PURE). NEJM. — PubMed PMID: 33626252
- Liu S et al. (2000). A prospective study of dietary glycemic load, carbohydrate intake, and risk of coronary heart disease in US women. American Journal of Clinical Nutrition. — PubMed PMID: 10837285
- Sieri S, Krogh V (2017). Dietary glycemic index, glycemic load and cancer: an overview. Nutr Metab Cardiovasc Dis. — PubMed PMID: 27986350
- Johnston CS, Buller AJ (2005). Vinegar and peanut products as complementary foods to reduce postprandial glycemia. J Am Diet Assoc. — PubMed PMID: 16321601
- Shukla AP et al. (2015). Food order has a significant impact on postprandial glucose and insulin levels. Diabetes Care. — PubMed PMID: 26106234
PubMed Topic Searches
- PubMed: GI/GL and diabetes
- PubMed: GL and cardiovascular
- PubMed: Resistant starch
- PubMed: Meal sequencing
- PubMed: Personalized glucose response
External Authoritative Resources
- American Diabetes Association — Standards of Medical Care in Diabetes — the annually updated reference for HbA1c targets, diagnostic criteria, and treatment guidelines
- CDC National Diabetes Prevention Program
- CDC National Diabetes Statistics Report — source of the 2023 prevalence figure
- NIDDK — Diabetes Resource
- University of Sydney Glycemic Index Database — the authoritative searchable GI lookup
- PubMed — Blood sugar management research
Connections
- All Remedies
- Bitter Melon
- Berberine
- Fenugreek
- Cinnamon
- Gymnema
- Holy Basil
- Coriander Seeds
- Stevia
- Turmeric
- Ginger
- Black Seed
- Magnesium
- Chromium
- Inositol
- Choline
- Biotin
- Benfotiamine
- Vitamin D3
- Zinc
- Taurine
- Quercetin
- Resveratrol
- Vanadium
- Blood Sugar — Benefits
- Blood Sugar — History
- Berberine
- Cinnamon
- Fenugreek
- Gymnema
- Bitter Melon (herb profile)
- Chromium
- Magnesium
- Alpha-Lipoic Acid
- Alpha-Lipoic Acid — compound profile
- Inositol
- Fasting
- Exercise
- Mediterranean Diet
- GLP-1 Receptor Agonists
- Hemoglobin A1C
- Fasting Insulin
- Insulin Resistance
- Type 2 Diabetes
- Metabolic Syndrome
- Polycystic Ovary Syndrome
- Frederick Banting
- Blood Sugar (Main Hub)
- Glycemic Index & Load
- Insulin Resistance
- Continuous Glucose Monitoring
- Exercise & Meal Timing
- Endocrinology (Diabetes)
- Berberine
- Ketogenic Diet
- Lab Tests
- Food
- Diabetes