MESA Risk Calculator and CAC Age Percentiles: Reframing the Score
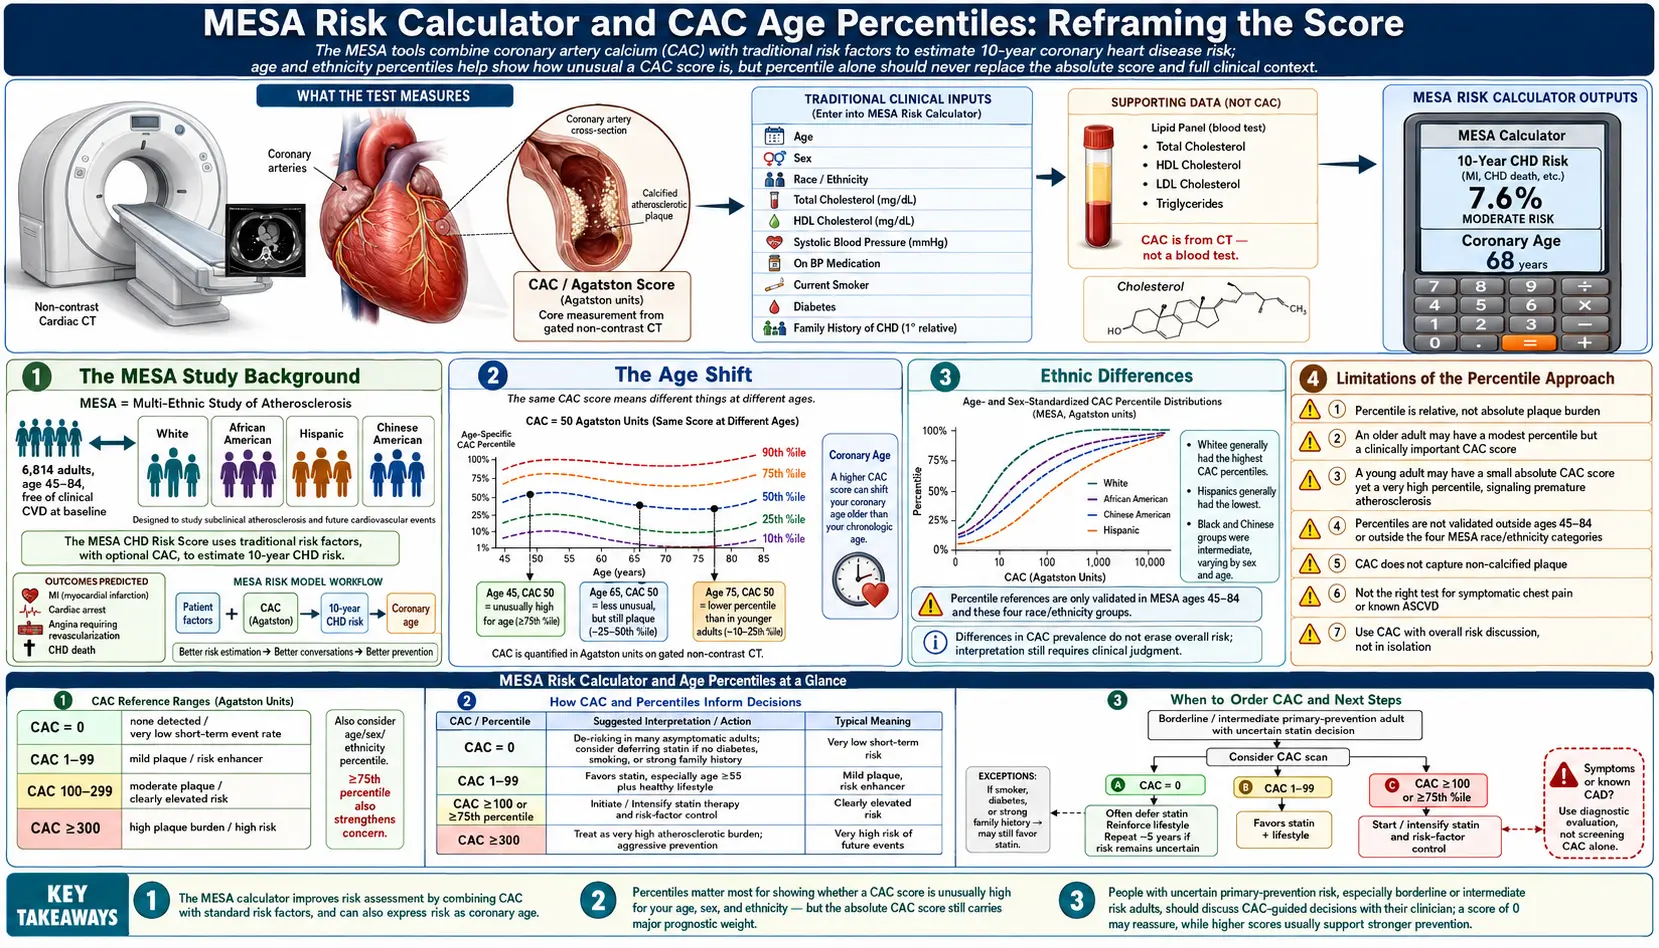
An absolute Agatston score of 100 means very different things at different ages. In a 45-year-old, a score of 100 puts the patient at roughly the 90th–95th percentile for age — a strong signal that something has gone wrong early. In a 75-year-old, the same score sits below the 50th percentile and may simply reflect normal accumulation. The Multi-Ethnic Study of Atherosclerosis (MESA) calculator is the standard tool for translating an absolute CAC score into an age- and sex-adjusted percentile, and it should be considered alongside the absolute score on every CAC report.
Table of Contents
- The MESA Study Background
- What a CAC Percentile Means
- MESA Calculator Inputs
- The Age Shift
- Sex Differences in CAC Distribution
- Ethnic Differences
- MESA 10-Year Risk Score
- Using the Percentile in Decision-Making
- Limitations of the Percentile Approach
- Research Papers and References
- Connections
- Featured Videos
The MESA Study Background
The Multi-Ethnic Study of Atherosclerosis (MESA) is a large, longitudinal NIH-funded study that has followed approximately 6,800 men and women aged 45–84 from four ethnic groups (white, Black, Hispanic, and Chinese) since 2000. Each participant received a baseline coronary calcium scan plus extensive cardiovascular phenotyping, and the cohort has been re-imaged and re-evaluated multiple times over the decades since.
The MESA dataset is the foundation of two key clinical tools: the MESA Calcium Score Reference Calculator (which provides age, sex, and ethnicity percentiles for any given CAC score) and the MESA 10-Year CHD Risk Score (which combines a CAC score with conventional risk factors to give an event-rate estimate). Both are freely available at mesa-nhlbi.org.
What a CAC Percentile Means
A CAC percentile tells you what fraction of the MESA reference population, matched for your age, sex, and (if specified) ethnicity, has a CAC score lower than yours. A 90th percentile result means 90% of similarly-matched people in MESA had a lower score — the test patient is in the highest-burden 10%.
This reframing matters because the underlying biology is age-cumulative. Coronary calcification develops slowly over decades, so older people simply have more of it on average. A high absolute number is expected at advanced age and not necessarily worrisome. A high percentile, by contrast, indicates accelerated disease for one's age — and that is what predicts future events.
MESA Calculator Inputs
The basic MESA percentile calculator takes:
- Age (45–84)
- Sex (male / female)
- Ethnicity (white, Black/African American, Hispanic, Chinese American)
- The Agatston score
It returns the corresponding percentile in the matched reference distribution. The calculator is online and free; many radiology reports include the percentile automatically.
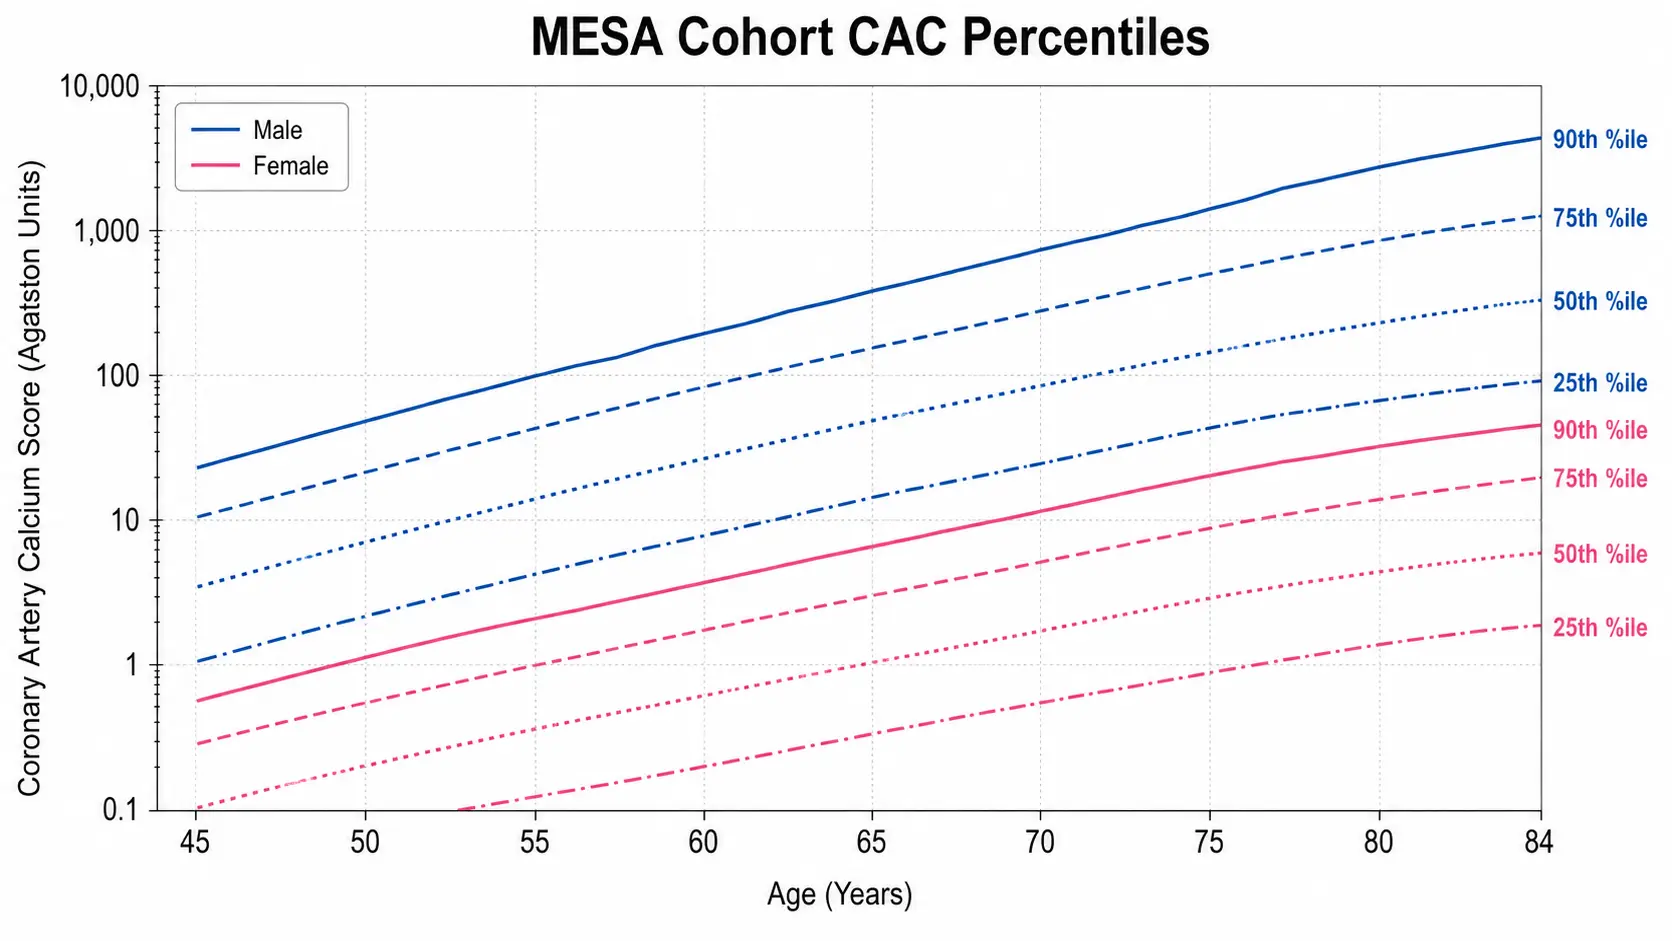
The Age Shift
The same Agatston score moves dramatically across the age spectrum. Approximate percentiles for a CAC of 100 in white males (illustrative; consult the calculator for exact values):
- Age 45 — ~95th percentile (alarming)
- Age 50 — ~85th–90th percentile (very high)
- Age 55 — ~75th–80th percentile (high)
- Age 60 — ~65th–70th percentile (moderately above average)
- Age 65 — ~55th–60th percentile (slightly above average)
- Age 70 — ~50th percentile (average)
- Age 75 — ~40th–45th percentile (below average)
- Age 80 — ~35th–40th percentile (well below average)
The clinical implication: a 45-year-old with a CAC of 100 needs aggressive prevention now. A 75-year-old with a CAC of 100 may not need any change in management beyond standard age-appropriate care.
Sex Differences in CAC Distribution
Women on average have lower CAC scores than men at any given age, with the gap closing after menopause. Approximate sex-difference patterns:
- At age 50, the median CAC score is 0 in women and ~5 in men
- At age 60, median CAC is ~5 in women and ~30 in men
- At age 70, median CAC is ~50 in women and ~150 in men
- At age 80, median CAC is ~200 in women and ~400 in men
The implication: a CAC of 100 in a 50-year-old woman is far more out of pattern than the same score in a 50-year-old man. The 90th-percentile cutoff in 50-year-old women is around CAC 25; in 50-year-old men it's around CAC 100. This pattern is one reason CAC testing is increasingly recommended at lower thresholds in women in their late 40s and 50s. See the Women & Younger Adults page.
Ethnic Differences
The MESA cohort showed meaningful ethnic differences in CAC distribution that survive adjustment for traditional risk factors:
- White Americans — reference category
- Black/African Americans — lower CAC than whites at any given age and lipid profile, despite having higher rates of clinical CV events. CAC underestimates risk in this population because more of the disease is non-calcified.
- Hispanic Americans — intermediate; CAC distribution similar to white Americans
- Chinese Americans — lowest CAC at any given age; lower clinical event rates as well
For Black patients especially, a low CAC should not be interpreted as exclusion of significant CV risk — conventional risk factors (hypertension, diabetes, lipids) and ApoB/Lp(a) measurements remain critical regardless of CAC.
MESA 10-Year Risk Score
The MESA 10-Year CHD Risk Score combines CAC with traditional risk factors (age, sex, race, total cholesterol, HDL, systolic blood pressure, treatment for hypertension, smoking, diabetes, family history) to estimate a personalized 10-year coronary heart disease event rate. The MESA risk score consistently outperforms the standard ASCVD risk calculator (which does not include CAC) in studies, particularly in adults at intermediate baseline risk.
Inputs and outputs are similar to the ASCVD calculator with the critical addition of the CAC score. Output is a 10-year percentage risk of myocardial infarction or cardiac death. A common decision rule: at intermediate baseline risk (5–20% by ASCVD), the MESA risk score with CAC included is the recommended tie-breaker for statin and aspirin decisions.
Using the Percentile in Decision-Making
Practical interpretive rules using percentile and absolute score together:
- Score = 0 at any age — very low risk; defer or de-escalate primary prevention pharmacotherapy. Re-scan in 5–10 years if risk factors are present.
- Score >0 but <75th percentile for age/sex — standard guideline-based prevention; CAC has identified some plaque but not accelerated disease.
- Score ≥75th percentile — consider intensification: statin, low-dose aspirin if other risk factors present, blood-pressure goal reduction.
- Score ≥90th percentile — aggressive prevention regardless of other risk factor levels; consider stress testing or CT angiography if symptoms are present.
- Absolute score ≥400 at any age — high event risk; cardiology consultation, consideration of additional testing.
- Absolute score ≥1000 at any age — very high event risk; comprehensive cardiology workup.
Limitations of the Percentile Approach
- The MESA cohort starts at age 45; younger patients lack good percentile reference data and effectively need their CAC interpreted on absolute terms (any >0 in someone under 40 is often clinically meaningful)
- The MESA cohort is US-based; ethnic distributions may differ from non-US populations
- Percentile is most useful for risk stratification; absolute score still drives some treatment decisions (statin recommendation at >100 regardless of percentile)
- Statin-treated patients have shifted CAC distributions; comparison to a treatment-naïve cohort like MESA may slightly overstate percentile in those already on therapy
- The percentile alone does not address vessel distribution (Left Main, proximal LAD) which can shift management even at relatively low total scores
The 75th and 90th percentile cutoffs are useful clinical heuristics rather than hard cliff edges. A 74th-percentile score is essentially the same as a 76th-percentile score — the trajectory and other risk factors matter more than the specific number.
Research Papers and References
- MESA CAC percentile reference — PubMed search
- MESA 10-year risk score — PubMed search
- Ethnic differences in CAC — PubMed search
- Sex differences in CAC — PubMed search
- ASCVD vs MESA risk calculators — PubMed search
External Authoritative Resources
Connections
- Coronary Calcium Score
- CAC in Women and Younger Adults
- Agatston Score Calculation and Interpretation
- ApoB
- Soft Plaque and CAC Limitations
- Reversal Plaque Stabilization and Lifestyle
- CAC Zero and the Power of Negative Result
- Insurance Cost and Access
- Statin Threshold and CAC
- CAC vs Other Cardiac Tests
- Lipoprotein(a)
- Lipid Panel
- Calcium
- Atherosclerosis
- Hypertension
- Diabetes
- Full Body MRI