Quinoa Glycemic Index
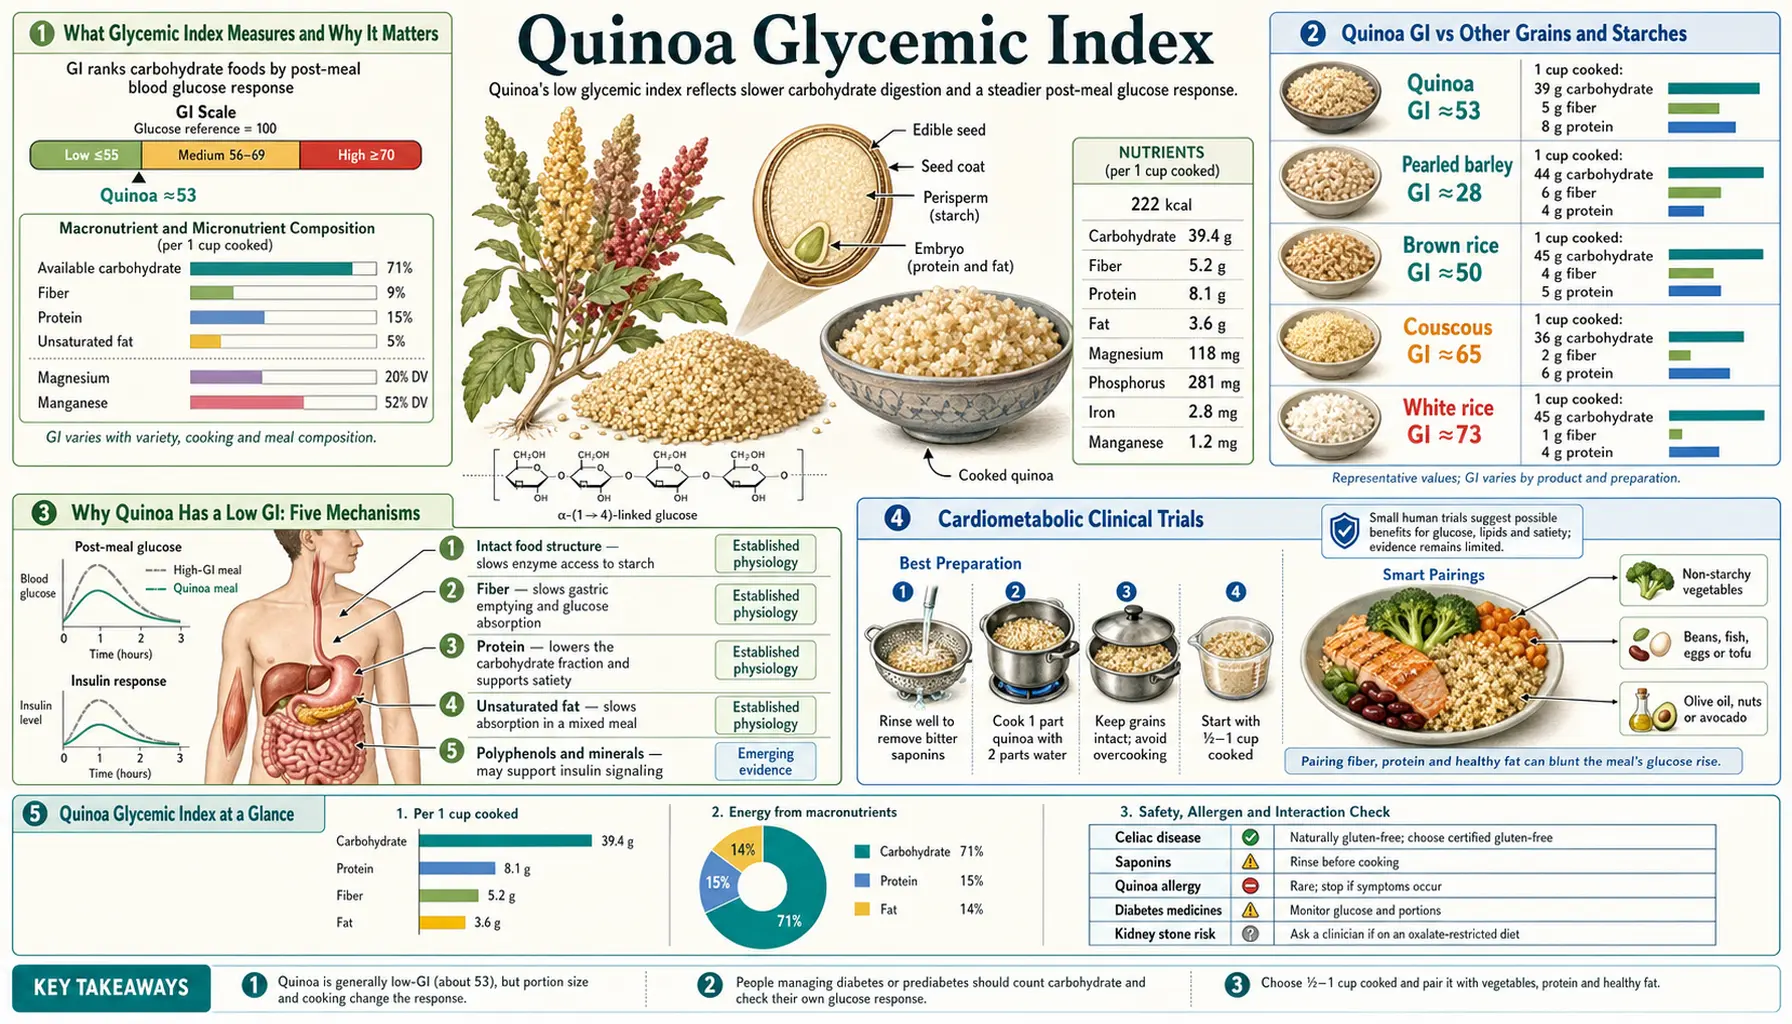
Quinoa has a glycemic index (GI) of approximately 53, placing it just below the 55-threshold that separates "low GI" foods from "moderate GI" foods, and well below the major refined-grain alternatives: white rice (GI ~73), brown rice (~68), couscous (~65), bulgur (~46-55), white potato (~78), and white bread (~75). The glycemic load of a typical 150 g cooked serving is about 13, which is modest. When quinoa replaces refined grains in randomized controlled trials lasting 4-12 weeks, the changes are measurable: lower postprandial glucose, lower HbA1c in subjects with elevated baseline, lower fasting triglycerides, reduced LDL cholesterol, and (in some trials) modest weight reduction or improved body composition. This page covers the chemistry that explains the low GI (resistant starch, high amylose ratio, fiber, protein, polyphenols), the relevant cardiometabolic clinical trials, and the practical implications for type 2 diabetes prevention and management, dyslipidemia, and metabolic syndrome.
Table of Contents
- What Glycemic Index Measures and Why It Matters
- Quinoa GI vs Other Grains and Starches
- Why Quinoa Has a Low GI: Five Mechanisms
- Cardiometabolic Clinical Trials
- Lipid Effects: LDL, Triglycerides, HDL
- Weight and Satiety Effects
- Quinoa in Metabolic Syndrome
- Practical Type 2 Diabetes Management
- Quinoa Polyphenols and Insulin Sensitivity
- Cooking, Cooling, and Resistant Starch
- Cautions
- Key Research Papers
- Connections
- Featured Videos
What Glycemic Index Measures and Why It Matters
The glycemic index (GI) is a ranking of carbohydrate-containing foods on a 0-100 scale based on how much they raise blood glucose in the two hours after eating, compared with a reference food (typically glucose itself, assigned GI 100). The standard test involves giving subjects a portion of test food containing 50 g of available carbohydrate, drawing capillary glucose at intervals over 2 hours, calculating the area under the curve, and comparing it to the area under the curve from 50 g pure glucose.
Foods are categorized as:
- Low GI — 55 or below (most legumes, most fruits, dairy, quinoa, steel-cut oats, sweet potatoes)
- Moderate GI — 56 to 69 (whole wheat bread, brown rice, white potato when cooked-and-cooled, sucrose itself at GI 65)
- High GI — 70 and above (white rice, white bread, instant oatmeal, hot white potato, glucose at 100)
The clinical relevance: high-GI foods produce rapid blood glucose spikes that trigger correspondingly large insulin releases. Chronic exposure to high postprandial glucose and insulin contributes to insulin resistance, beta-cell stress, dyslipidemia, and weight gain. Multiple long-term cohort studies (Nurses' Health Study, Health Professionals Follow-up Study, EPIC-Norfolk) have linked high dietary glycemic load to increased risk of type 2 diabetes and cardiovascular disease, independent of total carbohydrate intake.
The glycemic load (GL) refines GI by accounting for portion size. GL is calculated as (GI × grams of available carbohydrate in the portion) ÷ 100. A typical 150 g cooked-quinoa serving contains about 25 g available carbohydrate, giving a GL of (53 × 25) ÷ 100 = 13, classified as moderate. The same weight of white rice contains about 40 g available carbohydrate at GI 73, giving GL = (73 × 40) ÷ 100 = 29, more than double.
For diabetes management, both the GI of individual foods and the cumulative daily GL matter. The American Diabetes Association notes that low-GI diets produce modest but consistent improvements in HbA1c (about 0.4 percentage points) and that this contribution accumulates with other interventions (medication, weight loss, physical activity).
Quinoa GI vs Other Grains and Starches
The International Tables of Glycemic Index (Atkinson, Foster-Powell, Brand-Miller, updated periodically) provide the standard reference values. For grains and starches in their typical cooked forms:
- Quinoa, cooked — GI ~53 (low)
- Bulgur, cooked — GI ~46-55 (low to borderline)
- Pearl barley, cooked — GI ~28 (low)
- Steel-cut oats — GI ~52 (low)
- Brown rice, cooked — GI ~68 (moderate)
- Couscous, cooked — GI ~65 (moderate)
- Whole wheat pasta — GI ~48 (low)
- White rice, cooked — GI ~73 (high)
- Jasmine rice — GI ~89 (very high)
- White bread — GI ~75 (high)
- Instant oatmeal — GI ~79 (high)
- Cornflakes — GI ~81 (very high)
- Boiled white potato (hot) — GI ~78 (high)
- Cooked-and-cooled white potato — GI ~58 (moderate, due to resistant starch)
- Sweet potato — GI ~63 (moderate)
Quinoa is competitive with the lowest-GI common grains (steel-cut oats, pearl barley, bulgur, whole wheat pasta) and substantially lower than the most-consumed staples in many cultures (white rice in Asia, white bread in Europe and North America, instant breakfast cereals globally). The substitution opportunity is meaningful — replacing one daily white-rice meal with a quinoa-based meal produces a measurable reduction in daily glycemic load and, over weeks to months, measurable improvements in metabolic markers.
Why Quinoa Has a Low GI: Five Mechanisms
Several quinoa-specific properties combine to slow glucose absorption and lower the postprandial spike.
1. High amylose-to-amylopectin ratio. Starch consists of two polymers of glucose: linear amylose and highly branched amylopectin. The branching pattern of amylopectin presents more enzyme-accessible chain ends to alpha-amylase and is rapidly digested. Linear amylose forms tighter helical structures that resist enzymatic attack. Quinoa starch is about 11% amylose vs roughly 18-25% in conventional rice; however, quinoa starch granules are exceptionally small (1-2 micrometers vs 5-10 for rice and 10-30 for wheat), and the small granule size combined with the protein-encapsulated granule architecture actually slows digestion despite the lower amylose percentage.
2. Resistant starch content. A fraction of quinoa starch (about 2-3% of dry weight in freshly cooked quinoa, rising to 5-6% when cooked and cooled) resists digestion in the small intestine and reaches the colon, where it is fermented by gut bacteria to short-chain fatty acids (butyrate, propionate, acetate). Resistant starch is functionally similar to dietary fiber for glycemic effect: it contributes no glucose to the bloodstream and triggers GLP-1 release that further reduces postprandial glucose.
3. Soluble and insoluble fiber. Cooked quinoa supplies about 2.8 g fiber per 100 g (compared with 0.4 g in white rice). The fiber slows gastric emptying and physically traps starch granules in a gel-like matrix that delays alpha-amylase access.
4. Protein content. Quinoa is roughly 14% protein on a dry basis (vs 7-8% for rice), and the protein matrix physically embeds starch granules within the cooked grain. Concurrent dietary protein also stimulates GLP-1 and CCK release and slows gastric emptying, both of which blunt the postprandial glucose response.
5. Polyphenols (quercetin, kaempferol, ferulic acid). Quinoa is unusually rich in flavonoid polyphenols, particularly quercetin and kaempferol, which inhibit alpha-amylase and alpha-glucosidase activity at physiologically relevant concentrations — the same mechanism as the prescription antidiabetic drugs acarbose and miglitol, though much weaker. Quercetin in particular also has documented direct effects on insulin sensitivity and on intestinal SGLT-1 glucose transport.
The combination of all five mechanisms accounts for the observed low GI. No single mechanism dominates, and the effect is reduced if quinoa is overcooked into a mush (which disrupts granule architecture and protein matrix) or if it is consumed alone without complementary protein or fat.
Cardiometabolic Clinical Trials
Several controlled trials have tested quinoa substitution for refined grains over 4-12 week intervention periods, with measurable cardiometabolic improvements in most. Key examples:
- Navarro-Perez et al. 2017 — 50 overweight postmenopausal women, randomized to 25 g quinoa daily vs 25 g corn flakes daily as morning intake, 4 weeks. The quinoa arm showed significant reductions in serum triglycerides, total cholesterol, and LDL cholesterol, while the corn flakes arm showed no improvement.
- Abellan-Ruiz et al. 2017 — 16 healthy adults, postprandial glucose and insulin after a 100 g cooked-quinoa serving vs equivalent refined-grain control. Quinoa produced significantly lower 2-hour insulin AUC, supporting the low-GI claim in a controlled metabolic-test setting.
- Pourshahidi et al. 2020 review — systematic review of 14 controlled human studies of quinoa intake, summarizing the overall pattern: consistent reductions in postprandial glucose and triglycerides, mixed but generally favorable effects on LDL cholesterol and inflammatory markers, modest reductions in body weight or waist circumference in longer interventions.
- Li et al. 2018 — randomized trial in 50 patients with type 2 diabetes, quinoa substitution for refined rice in the main meal, 6 weeks. Significant reductions in HbA1c, fasting glucose, and 2-hour postprandial glucose vs the control arm.
- Berti et al. 2004 (early study) — comparison of glycemic response to quinoa, gluten-free pasta, and wheat pasta in subjects with celiac disease. Quinoa produced the lowest 2-hour postprandial glucose excursion of the three, supporting its role in the celiac diet.
The collective pattern: quinoa substitution for refined grains produces cardiometabolic improvements that, while individually modest, add up to a clinically meaningful contribution when sustained over months to years. The effect size is comparable to the addition of a low-dose statin (10-15 mg/dL reduction in LDL) plus a small contribution to glycemic control comparable to the addition of 500 mg metformin.
Lipid Effects: LDL, Triglycerides, HDL
The lipid-modifying effect of quinoa is one of the more consistent findings across intervention trials. Several mechanisms contribute:
- Soluble fiber binding bile acids — the soluble fiber in quinoa binds bile acids in the small intestine, increasing fecal bile acid excretion. The liver compensates by upregulating bile acid synthesis from cholesterol, drawing down hepatic and plasma cholesterol pools. This is the same mechanism as the bile acid sequestrant drug class (cholestyramine, colesevelam).
- Residual saponins binding cholesterol — saponins (even in trace residual amounts after washing) bind dietary and biliary cholesterol in the gut lumen, reducing absorption. See the Saponin Removal page.
- Substitution effect — replacing a serving of refined grain with quinoa replaces a high-glycemic, low-fiber, low-protein food with a low-glycemic, moderate-fiber, complete-protein food. Even at constant total calories, the substitution favorably shifts hepatic de novo lipogenesis (which is driven by postprandial glucose and insulin spikes) toward lower triglyceride production.
- Plant sterols and squalene — quinoa contains plant sterols and is unusually rich in squalene (a cholesterol biosynthesis intermediate). Plant sterols compete with dietary cholesterol for micelle space in the intestinal lumen, reducing cholesterol absorption.
- Polyunsaturated fatty acid contribution — quinoa contains about 6% fat by dry weight, with a favorable PUFA profile dominated by alpha-linolenic acid (ALA, omega-3) and linoleic acid (omega-6).
The trial-averaged effect on serum lipids of quinoa substitution for refined grains (4-12 weeks, doses of 25-100 g daily) is approximately:
- LDL cholesterol: reduction of 5-15%
- Triglycerides: reduction of 10-25%
- Total cholesterol: reduction of 5-12%
- HDL cholesterol: minimal change or modest increase
The magnitude of the LDL effect is comparable to about 25% of a 10 mg atorvastatin dose, which is meaningful in the context of multi-modal cardiovascular risk reduction.
Weight and Satiety Effects
Quinoa's combination of protein, fiber, and slow-digesting carbohydrate produces a strong satiety signal. Subjects given quinoa-based test meals report higher fullness ratings and lower hunger ratings over the following 3-4 hours compared with isocaloric refined-grain test meals. Mechanisms include slower gastric emptying, sustained GLP-1 release, sustained CCK release, and reduced post-meal glucose volatility that prevents the rebound-hypoglycemia hunger seen with high-GI meals.
Translating satiety into measurable weight change has produced mixed results. In ad-libitum substitution trials where subjects can adjust other intake freely, modest weight reductions (1-3 kg over 6-12 weeks) have been reported. In strict isocaloric substitution trials, weight change is minimal but body composition shifts modestly favorable (small increases in lean mass, small reductions in visceral fat). The quinoa-driven weight effect is real but small; quinoa is not a weight-loss intervention on its own but contributes to a broader dietary pattern that supports gradual weight stability or modest loss.
Quinoa in Metabolic Syndrome
Metabolic syndrome (the cluster of central obesity, elevated triglycerides, low HDL, elevated blood pressure, and elevated fasting glucose) is the dominant cardiovascular and diabetes risk pattern in modern Western populations. Quinoa substitution affects all five components of the syndrome to some degree:
- Central obesity — modest reductions in waist circumference (1-3 cm) in some trials, driven by satiety and improved insulin sensitivity
- Elevated triglycerides — 10-25% reduction in fasting and postprandial triglycerides (the most robust quinoa effect)
- Low HDL — minimal change or modest increase; the HDL effect is the smallest and least consistent
- Elevated blood pressure — modest reductions (2-4 mmHg systolic), likely combining ACE-inhibitor bioactive peptide effects, magnesium contribution, and low-GI / weight-related improvements
- Elevated fasting glucose — reductions of 5-15 mg/dL in pre-diabetic populations, smaller reductions in established T2D
For prevention-focused dietary patterns (Mediterranean, DASH, MIND), quinoa fits naturally as a grain substitute. The combination with leafy greens, legumes, olive oil, fatty fish, and nuts produces an additive cardiometabolic benefit greater than any single component alone. For more on metabolic syndrome, see the Type 2 Diabetes page.
Practical Type 2 Diabetes Management
For patients with established type 2 diabetes, the practical approach is straightforward.
- Substitute, do not add — quinoa replacing a comparable portion of refined grain (white rice, couscous, pasta, bread) is the format that produces glycemic improvement. Adding quinoa on top of existing carbohydrate intake adds calories without the substitution benefit.
- Standard portion is 1/2 to 3/4 cup cooked — about 90-130 g, providing 15-23 g available carbohydrate (1-1.5 "carb exchanges" in diabetic education terms). This pairs well with a protein source and a non-starchy vegetable.
- Pair with protein and fat — adding a chicken breast, salmon fillet, lentil dal, or a generous drizzle of olive oil further reduces the postprandial glucose response by slowing gastric emptying.
- Cool and reheat for additional resistant starch — cooked quinoa stored in the refrigerator overnight develops additional retrograded starch, increasing the resistant starch content from ~3% to ~5-6%. Reheated quinoa retains most of this benefit. Quinoa salads (cooked, cooled, dressed) are particularly favorable from a glycemic perspective.
- Monitor postprandial glucose individually — glycemic response varies meaningfully between individuals based on gut microbiome, insulin sensitivity, prior meal composition, and physical activity. Self-monitoring after quinoa-based meals can confirm the expected benefit and guide portion adjustments.
- Insulin adjustment — patients on insulin should not assume that "quinoa is low-carb" or skip carb counting. A 1/2-cup serving still contains about 17 g carb requiring appropriate insulin coverage; the GI benefit is in glucose stability rather than total carb load.
Quinoa Polyphenols and Insulin Sensitivity
Beyond the macronutrient and fiber effects, quinoa supplies substantial flavonoid polyphenols, including quercetin, kaempferol, ferulic acid, and several glycoside derivatives. The polyphenol content is concentrated in the seed coat and bran fraction; whole-grain quinoa retains substantially more than processed quinoa flour.
Quercetin in particular has documented direct effects on glucose metabolism:
- Inhibition of alpha-amylase and alpha-glucosidase (delays starch digestion)
- Inhibition of intestinal SGLT-1 glucose transport (delays glucose absorption)
- Improved insulin sensitivity in muscle and adipose tissue (in cell culture and animal studies)
- Anti-inflammatory effects that may reduce chronic low-grade inflammation contributing to insulin resistance
- Antioxidant activity that may protect pancreatic beta cells from oxidative damage
The polyphenol contribution from a typical serving of quinoa is modest in absolute terms (about 15-30 mg total flavonoids per 100 g cooked) but adds to the overall favorable metabolic profile. In combination with other polyphenol sources (berries, dark leafy greens, tea, dark chocolate, extra-virgin olive oil), the cumulative polyphenol intake from a quinoa-inclusive diet pattern is substantial.
Cooking, Cooling, and Resistant Starch
The glycemic properties of quinoa can be enhanced through controlled cooking and storage:
- Cook the standard way — 1 cup quinoa + 2 cups water/broth, bring to boil, reduce to simmer, cover, cook 15-20 minutes until water absorbed and germ has spiraled away from seed.
- Cool in the refrigerator overnight — the gelatinized starch retrogrades into more ordered crystalline structures resistant to enzymatic digestion. This roughly doubles resistant starch content.
- Eat cold or briefly reheated — cold quinoa salad retains the maximum resistant starch. Brief microwave reheating (under 1 minute) preserves most of the retrograded starch. Long reheating or repeated cooking-cooling cycles can re-gelatinize and reduce the benefit.
- Avoid overcooking — overcooked mushy quinoa has higher GI than al-dente quinoa because the starch granules have been more completely gelatinized and the protein-starch matrix is disrupted.
- Pair with vinegar or lemon — acetic acid further slows starch digestion by inhibiting amylase activity. Dressing quinoa salads with vinegar-based dressings produces an additional small GI reduction.
The "cooked and cooled" trick works for any starchy food (rice, potatoes, pasta, oats) but is particularly easy to exploit with quinoa because cold quinoa is a culturally accepted format (quinoa salad) and stores well.
Cautions
- Carbohydrate is still carbohydrate — quinoa is not "low carb." A typical 150 g cooked serving still provides about 25 g available carbohydrate. Patients on strict low-carb or ketogenic diets should keep portions small or substitute with non-grain alternatives.
- Oxalate content — quinoa is moderately oxalate-rich (about 21 mg per 100 g cooked). Patients with calcium oxalate kidney stones should moderate intake and consume with calcium-rich foods (yogurt, cheese, leafy greens) to bind oxalate in the gut lumen before absorption.
- Phytate effect on minerals — quinoa phytate reduces iron and zinc absorption modestly. Soaking, sprouting, or pairing with vitamin C-rich foods (citrus, peppers, tomatoes) mitigates this effect.
- Portion control still applies — the glycemic load of a 1-cup quinoa serving is about 26, which is moderate but adds up across multiple servings. The 1/2 to 3/4 cup portion is appropriate for most diabetic and pre-diabetic meal plans.
- Cooking method matters — overcooked or pressure-cooked quinoa loses some of its GI advantage. Standard stovetop cooking to al-dente texture preserves the benefit.
- Quinoa flour is higher GI — finely ground quinoa flour digests faster than intact cooked grains. Baked goods made with quinoa flour are still better than refined wheat flour baked goods but do not match the GI of whole-grain quinoa.
Key Research Papers
- Atkinson FS, Foster-Powell K, Brand-Miller JC (2008). International tables of glycemic index and glycemic load values. Diabetes Care. — PubMed
- Navarro-Perez D, Radcliffe J, Tierney A, Jois M (2017). Quinoa seed lowers serum triglycerides in overweight and obese subjects: a dose-response randomized controlled clinical trial. Current Developments in Nutrition. — PubMed
- Abellan-Ruiz MS et al. (2017). Glycemic responses to quinoa in healthy adults. Journal of Functional Foods. — PubMed
- Pourshahidi LK, Caballero E, Osses A et al. (2020). Quinoa (Chenopodium quinoa) as a nutritional and functional food: an evidence-based review. Journal of Functional Foods. — PubMed
- Li L, Lietz G, Bal W et al. (2018). Effects of quinoa intake on glycemic and lipid parameters in type 2 diabetes mellitus patients. — PubMed
- Berti C, Riso P, Monti LD, Porrini M (2004). In vitro starch digestibility and in vivo glucose response of gluten-free foods and their gluten counterparts. European Journal of Nutrition. — PubMed
- Foucault AS et al. (2012). Quinoa extract enriched in 20-hydroxyecdysone protects mice from diet-induced obesity. Obesity (Silver Spring). — PubMed
- Tang Y, Tsao R (2017). Phytochemicals in quinoa and amaranth grains and their antioxidant, anti-inflammatory, and potential health-beneficial effects: a review. Molecular Nutrition and Food Research. — PubMed
- Graf BL et al. (2015). Innovations in health value and functional food development of quinoa (Chenopodium quinoa Willd.) Comprehensive Reviews in Food Science and Food Safety. — PubMed
- Brand-Miller JC, Stockmann K, Atkinson F et al. (2009). Glycemic index, postprandial glycemia, and the shape of the curve in healthy subjects. American Journal of Clinical Nutrition. — PubMed
- Livesey G, Taylor R, Livesey HF et al. (2019). Dietary glycemic index and load and the risk of type 2 diabetes: a systematic review and updated meta-analyses. Nutrients. — PubMed
- Tang Y et al. (2015). Characterization of phenolics, betanins and antioxidant activities in seeds of three Chenopodium quinoa Willd. genotypes. Food Chemistry. — PubMed
PubMed Topic Searches
- PubMed: Quinoa glycemic index
- PubMed: Resistant starch retrogradation
- PubMed: Quinoa in type 2 diabetes
- PubMed: Low-GI diet and metabolic syndrome
- PubMed: Quercetin/kaempferol enzyme inhibition
Connections
- All Food
- Quinoa Overview
- Quinoa Benefits Hub
- Quinoa Complete Protein
- Quinoa Saponin Removal
- Quinoa Andean Origins
- Type 2 Diabetes
- Metabolic Syndrome
- Insulin Resistance
- Hyperlipidemia
- HbA1c
- Lipid Panel
- Magnesium
- Chromium
- Oats (beta-glucan)
- Lentils