Alanine for Liver Function (ALT — Alanine Aminotransferase)
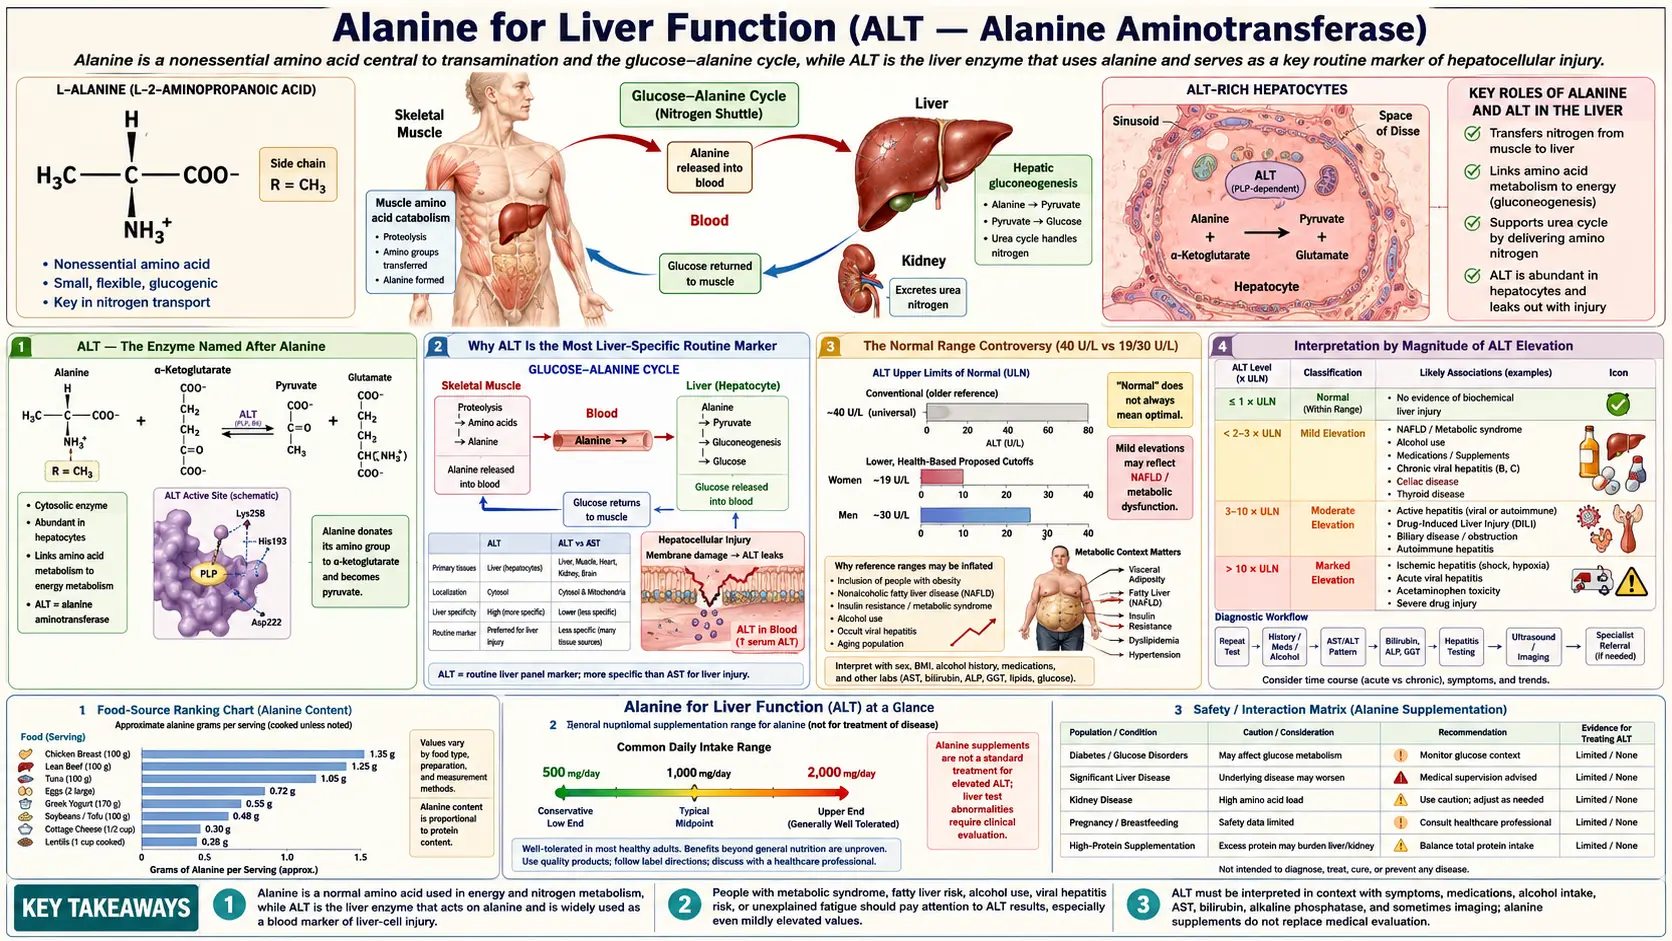
Alanine aminotransferase (ALT, historically SGPT) is the single most-ordered biomarker on every standard liver panel in clinical medicine worldwide. The enzyme is named after alanine because it catalyzes the central transamination between alanine and alpha-ketoglutarate to produce pyruvate and glutamate — the entry step into hepatic gluconeogenesis. ALT is present at extraordinarily high concentrations inside hepatocytes (roughly 3,000-fold higher than serum levels) and at very low concentrations in all other tissues. The combination of liver-specific localization and high intracellular concentration makes serum ALT the most sensitive routine biochemical marker of hepatocyte injury: even modest liver-cell damage releases enough enzyme to produce measurable serum elevations. The 21st-century transformation of population liver disease — the global emergence of non-alcoholic fatty liver disease (NAFLD), now affecting approximately a quarter of all adults worldwide — has elevated ALT from a hepatology workup tool to a routine population health screen for metabolic dysfunction. This page covers the biochemistry of ALT, the interpretation of ALT elevation patterns, the AST:ALT ratio in distinguishing different liver pathologies, modern healthy-range cutoffs, NAFLD epidemiology, drug-induced liver injury, and the practical workup of an isolated ALT elevation.
Table of Contents
- ALT — The Enzyme Named After Alanine
- Why ALT Is the Most Liver-Specific Routine Marker
- The Normal Range Controversy (40 U/L vs 19/30 U/L)
- Interpretation by Magnitude of ALT Elevation
- The AST:ALT Ratio — Alcoholic vs Non-Alcoholic Patterns
- NAFLD — The Global Liver Disease Epidemic
- Drug-Induced Liver Injury (DILI)
- Viral Hepatitis Pattern
- Practical Workup of an Isolated ALT Elevation
- The Alanine Load Test for Hepatic Function
- Cautions
- Key Research Papers
- Connections
- Featured Videos
ALT — The Enzyme Named After Alanine
Alanine aminotransferase (ALT, EC 2.6.1.2) is one of the two principal aminotransferases of clinical interest, the other being aspartate aminotransferase (AST, EC 2.6.1.1, historically SGOT). Both enzymes use pyridoxal-5-phosphate (the active form of vitamin B6) as cofactor and catalyze reversible transamination reactions. ALT catalyzes:
L-alanine + alpha-ketoglutarate ↔ pyruvate + L-glutamate
This is the rate-limiting entry step for alanine's contribution to hepatic gluconeogenesis. In muscle, ALT runs the same reaction in the forward direction (consuming pyruvate and glutamate to produce alanine for nitrogen export); in liver, it runs in reverse (consuming alanine to produce pyruvate for gluconeogenesis). The directional preference depends on cell-specific concentrations of the four reactants and on the cell's gluconeogenic vs gluconeogenic-suppressed state.
ALT exists in two isozymic forms in humans: ALT1 (cytosolic, encoded by GPT) and ALT2 (mitochondrial, encoded by GPT2). The cytosolic ALT1 is the predominant form in liver and the form that is measured on standard liver panels. The mitochondrial ALT2 is more highly expressed in muscle, heart, and brain — tissues where the alanine-shuttle role is less critical — and contributes only modestly to serum activity in healthy adults.
The historical name SGPT (serum glutamic-pyruvic transaminase) reflects the products of the reaction (glutamate and pyruvate) rather than the substrate (alanine). The shift to the ALT nomenclature occurred gradually through the 1980s and 1990s as the systematic IUPAC enzyme nomenclature became the international standard. Older patients and some European laboratories may still report SGPT; this is the same enzyme as ALT.
Why ALT Is the Most Liver-Specific Routine Marker
ALT's clinical usefulness depends on two facts:
- Hepatocytes contain extremely high ALT concentrations — approximately 3,000-fold higher than serum concentrations. Even modest hepatocyte injury releases enough enzyme to produce measurable serum elevations within hours.
- Other tissues contain relatively little ALT — kidney, heart, and skeletal muscle contain detectable but much lower ALT activity. The serum ALT pool in a healthy adult therefore predominantly reflects hepatic origin.
AST is the more revealing contrast. AST is also abundant in liver, but is equally abundant in skeletal muscle, cardiac muscle, kidney, brain, and red blood cells. Hemolysis during phlebotomy can artifactually elevate AST. Vigorous exercise can elevate AST significantly. Acute myocardial infarction historically caused dramatic AST elevations (which is why AST was originally used as a cardiac marker before cardiac-specific troponins came along). All of these confounders are absent or markedly reduced for ALT.
The clinical inference is that an isolated ALT elevation almost always reflects hepatocyte injury, while an AST elevation must always be interpreted in light of possible non-hepatic sources. This is the basis for the diagnostic primacy of ALT in hepatology workups and for the AST:ALT ratio as a discriminator (see below).
There are a few specific exceptions worth mentioning:
- Severe muscle injury (rhabdomyolysis) can elevate ALT modestly due to release from skeletal muscle. The CK (creatine kinase) elevation will be the dominant finding and will dwarf the ALT changes.
- Inflammatory myopathies (polymyositis, dermatomyositis) can produce chronic mild ALT elevations from muscle origin. CK, aldolase, and clinical features distinguish from primary liver disease.
- Celiac disease can produce mild ALT elevations through poorly understood gut-liver axis mechanisms; the elevations resolve on a gluten-free diet.
- Strenuous exercise within 24-48 hours of blood draw can mildly elevate both ALT and AST through muscle origin. Repeat testing after exercise abstinence clarifies.
The Normal Range Controversy (40 U/L vs 19/30 U/L)
The standard laboratory "normal range" for ALT is typically reported as up to 40 U/L (some labs use up to 35 U/L). These ranges were originally derived in the 1970s from blood donor populations that, in retrospect, included many subjects with subclinical NAFLD and chronic viral hepatitis (then unrecognized). The result is that the "normal range" was set too high — many subjects within the reported normal range actually had liver pathology.
The Prati 2002 Annals of Internal Medicine study redefined healthy ALT ranges using a much more rigorously screened reference population (blood donors with no clinical or laboratory evidence of liver disease, no BMI above 25, no metabolic syndrome). The Prati cutoffs are:
- Men: upper limit of normal 30 U/L (not 40)
- Women: upper limit of normal 19 U/L (not 40)
The Prati cutoffs have not been universally adopted by clinical laboratories, partly because the implications are uncomfortable: applying the stricter cutoffs to the general population reclassifies a substantial fraction of presumably-healthy adults as having mildly abnormal ALT. The NHANES population data show that roughly 20-30% of US adults have ALT above the Prati upper limit, which corresponds well to the prevalence of NAFLD established by hepatic ultrasound and biopsy studies.
The clinical practical implication is that an ALT of 35 U/L — clearly within the standard 40 U/L reporting cutoff — should not be reflexively dismissed as "normal," especially in a woman or in a patient with metabolic risk factors. The 2017 ACG Clinical Guideline (Kwo et al.) explicitly endorses the Prati cutoffs for clinical decision-making in the workup of liver disease, even when the local laboratory continues to report up to 40 U/L as "normal."
For patients tracking their own liver health, the practical rule of thumb is:
- ALT below 19 (women) or 30 (men): truly normal, no further action needed unless other indicators warrant.
- ALT 19-40 (women) or 30-40 (men): below the lab's reported upper limit but above the Prati cutoff. Reasonable trigger for a metabolic workup (lipids, A1c, BMI, alcohol screen) and re-check in 6 months.
- ALT 40-150 U/L: mildly elevated by any standard. Workup as described in the practical workup section below.
- ALT >150 U/L: moderately elevated. Always abnormal, always warrants workup. Refer to hepatology for ALT >500.
Interpretation by Magnitude of ALT Elevation
The magnitude of ALT elevation correlates roughly with the type of underlying liver pathology, providing a useful clinical heuristic:
- Mild elevation (1-2x ULN; ALT 40-80 U/L): Most commonly NAFLD, mild drug-induced liver injury (statins, acetaminophen, anti-tuberculosis agents), chronic viral hepatitis (HBV, HCV) in the inactive or low-replication phase, alcoholic liver disease (early), autoimmune hepatitis (mild), hemochromatosis, alpha-1 antitrypsin deficiency, Wilson disease (rarely).
- Moderate elevation (2-10x ULN; ALT 80-400 U/L): Active chronic viral hepatitis, moderate-severe NAFLD/NASH, autoimmune hepatitis with active inflammation, moderate drug-induced liver injury, alcoholic hepatitis (typically with AST > ALT), early acute viral hepatitis (rising phase).
- Marked elevation (10-25x ULN; ALT 400-1000 U/L): Acute viral hepatitis (peak phase), severe drug-induced liver injury, autoimmune hepatitis with severe inflammation, acute ischemic hepatitis (typically very high AST > ALT). Begin hepatology consultation.
- Massive elevation (>25x ULN; ALT >1000 U/L): The differential narrows to three principal causes: (1) acute viral hepatitis (HAV, HBV, occasionally HEV), (2) severe drug-induced liver injury (most classically acetaminophen overdose), and (3) ischemic hepatitis (shock liver). Acetaminophen toxicity in particular can produce ALT in the 5000-10000 U/L range, often the highest values seen in clinical practice. Urgent hepatology consultation. Assess for fulminant hepatic failure (INR, encephalopathy).
The rate of change of ALT is also informative. Acute hepatitis typically rises over days and then falls predictably as the injury resolves. Chronic liver disease typically shows stable mildly-elevated values over months. A sudden rise in a previously stable ALT prompts workup for a new injury (drug, infection, ischemic event).
The AST:ALT Ratio — Alcoholic vs Non-Alcoholic Patterns
The ratio of AST to ALT (often written as AST/ALT or De Ritis ratio after the Italian biochemist who first proposed it in 1957) provides important diagnostic information about the underlying liver process:
- AST:ALT < 1 (more ALT than AST): The pattern of most non-alcoholic liver disease. Found in NAFLD/NASH (typically 0.7-1.0), chronic viral hepatitis (B and C in the chronic phase), acute viral hepatitis, drug-induced hepatitis, autoimmune hepatitis, hemochromatosis. This is the "default" hepatocellular pattern.
- AST:ALT > 2 (twice as much AST as ALT): Strongly suggestive of alcoholic liver disease. The classic Cohen-Kaplan 1979 paper established that AST:ALT > 2 has a positive predictive value of approximately 80% for alcoholic etiology in the setting of liver disease. The mechanism involves chronic alcohol-induced depletion of pyridoxal-5-phosphate (vitamin B6), which reduces both ALT and AST synthesis but reduces ALT more (ALT has a stricter B6 dependence) — so the ratio shifts toward AST dominance.
- AST:ALT > 1 (but < 2): A "gray zone" that includes early cirrhosis from any cause (the AST:ALT ratio rises as cirrhosis progresses regardless of the original etiology), NASH-related cirrhosis, and a mix of alcoholic and non-alcoholic disease.
- AST:ALT > 4-5 (very high): Suggests acute Wilson disease with hemolysis, severe alcoholic hepatitis, or muscle injury contaminating the test (rhabdomyolysis would also show very high CK).
The Williams-Hoofnagle 1988 Gastroenterology paper expanded the diagnostic value of the AST:ALT ratio specifically for cirrhosis assessment: as liver disease progresses from chronic active inflammation to cirrhosis, the AST:ALT ratio rises regardless of the original etiology. A NASH patient who starts with AST:ALT of 0.7 may have AST:ALT of 1.4 by the time NASH-related cirrhosis develops. This makes serial AST:ALT trending useful for monitoring chronic liver disease progression.
The clinical use of the De Ritis ratio is therefore twofold: (1) initial differential diagnosis of acute or chronic liver disease (alcoholic vs non-alcoholic, principally), and (2) monitoring chronic liver disease progression toward cirrhosis. Both uses are based on the same biochemistry — the differential B6-cofactor dependence of ALT vs AST, modulated by the underlying disease's effect on hepatic protein synthesis.
NAFLD — The Global Liver Disease Epidemic
Non-alcoholic fatty liver disease (NAFLD), recently renamed metabolic-dysfunction-associated steatotic liver disease (MASLD) in the 2023 multi-society consensus, has become the leading cause of chronic liver disease worldwide. The Younossi 2016 Hepatology meta-analysis estimated global prevalence at approximately 25% of adults, with substantial regional variation: about 32% in South America, 27% in Asia, 24% in North America, 24% in Europe, and 31% in the Middle East. In the United States, the National Health and Nutrition Examination Survey (NHANES) data suggest that 30-40% of adults have hepatic steatosis on imaging, of whom an estimated 5-10% have progressed to the more severe non-alcoholic steatohepatitis (NASH) with active inflammation and fibrosis.
NAFLD/MASLD is best understood as the hepatic manifestation of metabolic syndrome — the cluster of central obesity, insulin resistance, atherogenic dyslipidemia, hypertension, and type 2 diabetes that has become the dominant chronic disease pattern in developed and rapidly developing economies. The pathophysiology involves:
- Excess hepatic fatty acid delivery — from dietary fat, from de novo lipogenesis driven by chronic hyperinsulinemia, and from accelerated lipolysis of insulin-resistant visceral adipose tissue. The hepatocyte's capacity to package and export triglyceride as VLDL is exceeded.
- Hepatic triglyceride accumulation — visible as macrovesicular steatosis on biopsy and as hepatic steatosis on ultrasound, CT, or MRI elastography.
- Lipotoxicity-induced hepatocyte injury — the accumulated free fatty acids, diacylglycerols, and ceramides activate inflammatory cytokine production and apoptotic pathways. Cell death releases ALT into the circulation.
- Hepatic stellate cell activation — the wound-healing response to chronic hepatocyte injury produces collagen deposition and progressive fibrosis. Over years to decades, this can progress to cirrhosis.
ALT elevation is the most accessible biochemical signal of this process, but ALT has poor sensitivity for NAFLD. The Mofrad 2003 study famously documented histologically severe NAFLD with normal ALT values in approximately 20% of NAFLD patients. The implication is that a normal ALT does not exclude NAFLD — imaging (ultrasound, MRI-PDFF, or transient elastography) is needed when the clinical suspicion is high (BMI > 30, type 2 diabetes, metabolic syndrome features).
Management of NAFLD is currently behavioral and pharmacological:
- Weight loss — the single most effective intervention. A 5% body weight loss reverses steatosis in most patients; 7-10% loss can reverse early fibrosis.
- Mediterranean diet — emphasizing whole foods, olive oil, fish, vegetables; modest carbohydrate restriction; minimization of fructose-containing sweetened beverages.
- Regular aerobic exercise — independent benefit beyond the weight loss effect.
- Pharmacological options — pioglitazone (an insulin sensitizer with proven NASH benefit), GLP-1 receptor agonists (semaglutide and tirzepatide both show significant NASH improvement), and resmetirom (recently FDA-approved specifically for NASH with fibrosis).
For more on NAFLD, see our pages on Metabolic Syndrome and Liver Disease.
Drug-Induced Liver Injury (DILI)
Drug-induced liver injury is the most common cause of acute liver failure in the developed world and a frequent cause of elevated ALT. Hundreds of medications and herbal products have been implicated. The patterns of injury fall into three principal categories:
- Hepatocellular pattern — ALT predominantly elevated relative to alkaline phosphatase. Suggests injury to hepatocytes. Classic offenders: acetaminophen overdose (highest ALT seen in clinical practice), isoniazid, statins, methotrexate, valproate, kava, green tea extract at high doses.
- Cholestatic pattern — alkaline phosphatase predominantly elevated relative to ALT. Suggests injury to biliary epithelium or impaired bile flow. Classic offenders: amoxicillin-clavulanate, anabolic steroids, chlorpromazine, erythromycin estolate, oral contraceptives.
- Mixed pattern — both ALT and alkaline phosphatase elevated, often with the R-value (ALT/ULN divided by ALP/ULN) between 2 and 5. Classic offenders: phenytoin, sulfonamides, carbamazepine.
Specific medications worth knowing:
- Acetaminophen — the most common cause of drug-induced acute liver failure in the United States. Toxicity occurs at doses above 4 g/day (acute), or above 2-3 g/day chronically in heavy alcohol users. ALT peaks at 48-72 hours after ingestion, often in the thousands to tens of thousands. N-acetylcysteine (NAC) is the antidote when given within 8-10 hours of ingestion.
- Statins — mild ALT elevations in 1-3% of users. The Cohen-Anania-Chalasani 2006 hepatologist consensus established that mild statin-associated ALT elevation is not a contraindication to continued therapy in patients without underlying liver disease; it is a marker rather than a clinically meaningful injury. Severe statin hepatotoxicity is rare.
- Isoniazid — ALT elevation in up to 20% of treated patients, with clinical hepatitis in 0.5-2%. Monthly LFT monitoring is standard during anti-tuberculosis therapy.
- Anabolic steroids — produce a distinctive cholestatic pattern with characteristic bile duct injury. Sometimes overlooked in young athletic men presenting with jaundice.
- Herbal hepatotoxins — kava, green tea extract (high-dose), comfrey, germander, chaparral, pyrrolizidine alkaloid-containing herbs (e.g., some bush teas). Underrecognized cause of unexplained ALT elevation; always take a detailed herbal and supplement history.
The standard approach to suspected DILI is the modified Roussel-Uclaf Causality Assessment Method (RUCAM), which scores the temporal relationship, exclusion of other causes, risk factors, response to dechallenge, and prior knowledge of hepatotoxicity to estimate the probability that a specific agent caused the observed injury.
Viral Hepatitis Pattern
Viral hepatitis remains an important cause of ALT elevation worldwide. The clinical context and serology determine the workup:
- Hepatitis A (HAV) — acute self-limited infection, fecal-oral transmission, peak ALT typically 1000-3000 U/L. Confirmed by anti-HAV IgM. No chronic phase, no specific antiviral treatment, supportive care only. Vaccine-preventable.
- Hepatitis B (HBV) — acute or chronic infection, blood/sexual transmission, ALT pattern varies by phase. Chronic HBV may have ALT in the normal range during the immune-tolerant phase, mildly elevated during active replication, and very high during reactivation or HBeAg seroconversion. Confirmed by HBsAg (chronic carrier), anti-HBs (immunity), anti-HBc IgM (acute infection). Vaccine-preventable. Multiple effective antivirals available.
- Hepatitis C (HCV) — usually chronic infection, blood-borne transmission, often mild ALT elevation or even normal ALT. Confirmed by anti-HCV antibody and HCV RNA PCR. Curable in >95% of cases with 8-12 weeks of direct-acting antiviral therapy (sofosbuvir-velpatasvir or glecaprevir-pibrentasvir).
- Hepatitis D (HDV) — defective virus that requires HBsAg coexpression. Test only when HBsAg-positive.
- Hepatitis E (HEV) — fecal-oral or zoonotic transmission, acute self-limited in most cases but can be devastating in pregnancy. Confirmed by anti-HEV IgM and PCR.
- EBV, CMV, herpes simplex virus — can produce mild-to-moderate transient ALT elevations during acute viral syndromes. Usually presents with characteristic clinical features (fever, lymphadenopathy, atypical lymphocytosis).
The standard initial viral panel for an unexplained ALT elevation is HBsAg, anti-HCV, and (in appropriate clinical settings) anti-HAV IgM and anti-HIV.
Practical Workup of an Isolated ALT Elevation
The Kwo 2017 ACG Clinical Guideline and the Newsome 2018 BSG guideline both provide structured approaches to the patient with an isolated ALT elevation. A practical synthesis:
- Confirm and characterize — repeat the LFTs to ensure the elevation is real and not laboratory artifact. Calculate the AST:ALT ratio and the R-value (ALT/ULN ÷ ALP/ULN). Check INR and albumin for synthetic function assessment.
- History — alcohol intake (use AUDIT-C), medication and herbal supplement use, IV drug use risk factors, sexual risk factors, travel history, family history of liver disease, occupational exposures, prior episodes of jaundice, autoimmune disease history.
- Physical examination — BMI and waist circumference (metabolic syndrome), stigmata of chronic liver disease (palmar erythema, spider angiomata, gynecomastia, ascites, splenomegaly), Kayser-Fleischer rings (Wilson disease), arthritis (autoimmune hepatitis association).
- First-tier laboratory workup — metabolic panel (fasting glucose, A1c, lipid panel for NAFLD risk stratification), HBsAg, anti-HCV, ferritin and transferrin saturation (hemochromatosis), ANA and ASMA (autoimmune hepatitis), tissue transglutaminase IgA (celiac).
- Imaging — abdominal ultrasound for hepatic steatosis, biliary tree, and any focal lesions. MRI-PDFF if quantitative steatosis assessment is needed. Transient elastography (FibroScan) if fibrosis assessment is needed (NAFLD >F2 fibrosis is a hepatology referral trigger).
- Second-tier workup if first-tier negative — ceruloplasmin and 24-hour urinary copper (Wilson disease), alpha-1 antitrypsin level and Pi typing (alpha-1 antitrypsin deficiency), thyroid function (hypothyroidism-associated NAFLD), HIV testing, repeat viral hepatitis panel including HEV in appropriate clinical contexts.
- Specialty referral — ALT > 5x ULN despite negative initial workup; persistent ALT elevation >6 months without identified cause; any patient with cirrhosis or significant fibrosis (NAFLD >F2); fulminant presentation (rising INR, encephalopathy, jaundice).
- Liver biopsy — rarely needed in modern hepatology due to advances in non-invasive imaging and serological scoring. Indicated when the diagnosis remains unclear after the second-tier workup, or when management decisions require histological staging.
The most common ultimate diagnosis for an isolated mildly-elevated ALT in a developed-world primary care population is NAFLD, followed by chronic viral hepatitis (B or C), alcoholic liver disease, drug-induced injury, and autoimmune hepatitis. The rarer diagnoses (Wilson disease, alpha-1 antitrypsin deficiency, hemochromatosis) should be specifically considered in younger patients without obvious metabolic or behavioral risk factors.
The Alanine Load Test for Hepatic Function
The alanine load test is a research-grade assessment of hepatic functional reserve that uses an oral alanine dose (15-30 g) to challenge the gluconeogenic capacity of the liver. The post-load plasma glucose and alanine kinetics provide a sensitive measure of hepatic gluconeogenic capacity that is impaired earlier than conventional liver function markers.
In healthy subjects, oral alanine produces a brisk rise in plasma alanine peaking at 60-90 minutes, with proportional plasma glucose rise and glucagon secretion. The plasma alanine clearance half-life is approximately 90 minutes. The test was originally developed by Genuth and Castro in the 1970s for assessing fasting and obesity physiology, and subsequently adapted for research evaluation of hepatic function in cirrhosis, NASH, and post-bariatric patients.
The alanine load test is rarely used in routine clinical hepatology because non-invasive imaging (MRI elastography, FibroScan) and validated scoring systems (FIB-4, NAFLD Fibrosis Score, APRI) provide more practical assessments of hepatic function and fibrosis. The test remains useful in research settings where dynamic gluconeogenic capacity is the specific question of interest.
For patients curious about alanine's metabolic role in their own physiology, the clinical correlate is simpler: a standard glucose tolerance test (oral 75 g glucose with serial glucose and insulin measurements) implicitly assesses the post-load alanine response as part of the integrated postprandial metabolic state. Reactive hypoglycemia identified on a glucose tolerance test often reflects impaired alanine-mediated gluconeogenic counter-regulation.
Cautions
- An isolated mildly elevated ALT is common and often benign — 20-30% of US adults have ALT above the Prati cutoffs. Most have NAFLD that improves substantially with weight loss and Mediterranean diet. Not every mildly elevated ALT requires aggressive workup; clinical context is everything.
- Normal ALT does not exclude significant liver disease — up to 20% of NAFLD patients with significant histological injury have normal ALT (Mofrad 2003). Imaging is more sensitive than ALT for steatosis.
- Pyridoxal-5-phosphate (vitamin B6) deficiency lowers ALT — chronic alcohol abuse, malnutrition, and isoniazid use can all deplete B6 and produce artifactually low ALT values. This is part of the mechanism behind the AST:ALT > 2 pattern of alcoholic liver disease.
- Pregnancy lowers ALT — physiological dilution of plasma proteins during pregnancy reduces ALT activity by approximately 25%. A pregnant woman's ALT should be interpreted against pregnancy-specific reference ranges.
- Acetaminophen safety — do not exceed 4 g/day total in healthy adults, and limit to 2-3 g/day in regular alcohol users. Read all combination products carefully (many cold medicines and prescription pain medications contain acetaminophen and easily accumulate to toxic doses when stacked).
- Herbal supplement screening — take a detailed history including all over-the-counter and herbal products in any patient with unexplained ALT elevation. Kava, green tea extract at high doses, comfrey, chaparral, and pyrrolizidine alkaloid-containing teas are well-documented hepatotoxins.
- Heavy exercise within 48 hours of blood draw — can artifactually elevate both ALT and AST through muscle origin. If exercise is suspected as the cause, repeat the LFTs after 1 week of exercise abstinence.
- L-alanine supplementation does not affect ALT in any clinically meaningful way — the enzyme is constitutively expressed at very high levels; substrate availability is not rate-limiting under normal physiological conditions. Routine L-alanine supplements are not a treatment for elevated ALT, nor a cause of it.
Key Research Papers
- Pratt DS, Kaplan MM (2000). Evaluation of abnormal liver-enzyme results in asymptomatic patients. NEJM 342(17):1266-1271. — DOI: 10.1056/NEJM200004273421707
- Prati D, Taioli E, Zanella A, et al. (2002). Updated definitions of healthy ranges for serum alanine aminotransferase levels. Annals of Internal Medicine 137(1):1-10. — DOI: 10.7326/0003-4819-137-1-200207020-00006
- Kwo PY, Cohen SM, Lim JK (2017). ACG Clinical Guideline: Evaluation of abnormal liver chemistries. American Journal of Gastroenterology 112(1):18-35. — DOI: 10.1038/ajg.2016.517
- Newsome PN, Cramb R, Davison SM, et al. (2018). Guidelines on the management of abnormal liver blood tests. Gut 67(1):6-19. — DOI: 10.1136/gutjnl-2017-314924
- Younossi ZM, Koenig AB, Abdelatif D, et al. (2016). Global epidemiology of nonalcoholic fatty liver disease — meta-analytic assessment. Hepatology 64(1):73-84. — DOI: 10.1002/hep.28431
- Cohen JC, Horton JD, Hobbs HH (2011). Human fatty liver disease: old questions and new insights. Science 332(6037):1519-1523. — DOI: 10.1126/science.1204265
- Mofrad P, Contos MJ, Haque M, et al. (2003). Clinical and histologic spectrum of nonalcoholic fatty liver disease associated with normal ALT values. Hepatology 37(6):1286-1292. — DOI: 10.1053/jhep.2003.50229
- Williams ALB, Hoofnagle JH (1988). Ratio of serum aspartate to alanine aminotransferase in chronic hepatitis — relationship to cirrhosis. Gastroenterology 95(3):734-739. — DOI: 10.1016/s0016-5085(88)80022-2
- Cohen JA, Kaplan MM (1979). The SGOT/SGPT ratio — an indicator of alcoholic liver disease. Digestive Diseases and Sciences 24(11):835-838. — DOI: 10.1007/BF01324898
- Sookoian S, Pirola CJ (2012). Alanine and aspartate aminotransferase and glutamine-cycling pathway in NAFLD. World Journal of Gastroenterology 18(29):3775-3781. — DOI: 10.3748/wjg.v18.i29.3775
- Cohen DE, Anania FA, Chalasani N (2006). An assessment of statin safety by hepatologists. American Journal of Cardiology 97(8A):77C-81C. — DOI: 10.1016/j.amjcard.2005.12.014
- Larson AM, Polson J, Fontana RJ, et al. (2005). Acetaminophen-induced acute liver failure: results of a US multicenter, prospective study. Hepatology 42(6):1364-1372. — DOI: 10.1002/hep.20948
- Chalasani N, Younossi Z, Lavine JE, et al. (2018). The diagnosis and management of NAFLD: practice guidance from AASLD. Hepatology 67(1):328-357. — DOI: 10.1002/hep.29367
- Genuth SM, Castro J (1974). Effect of oral alanine administration in fasting obese subjects. Metabolism 23(4):375-386. — PubMed
PubMed Topic Searches
- PubMed: ALT and liver function testing
- PubMed: AST:ALT (De Ritis) ratio in liver disease
- PubMed: NAFLD/NASH and ALT
- PubMed: Drug-induced liver injury (DILI)
- PubMed: Prati healthy ALT cutoffs
- PubMed: Acetaminophen hepatotoxicity
Connections
- All Amino Acids
- Alanine Overview
- Alanine Benefits Hub
- Alanine for Gluconeogenesis & Blood Sugar
- Beta-Alanine for Endurance
- Alanine for Immune Function
- Glutamic Acid (Transamination Partner)
- Glutamine
- Vitamin B6 (ALT Cofactor)
- Liver Disease
- Metabolic Syndrome (NAFLD)
- Diabetes (NAFLD)
- Obesity (NAFLD)
- Lab Tests
- NAC (Acetaminophen Antidote)
- Liver Cleanse
- Milk Thistle