Potassium-Rich Foods
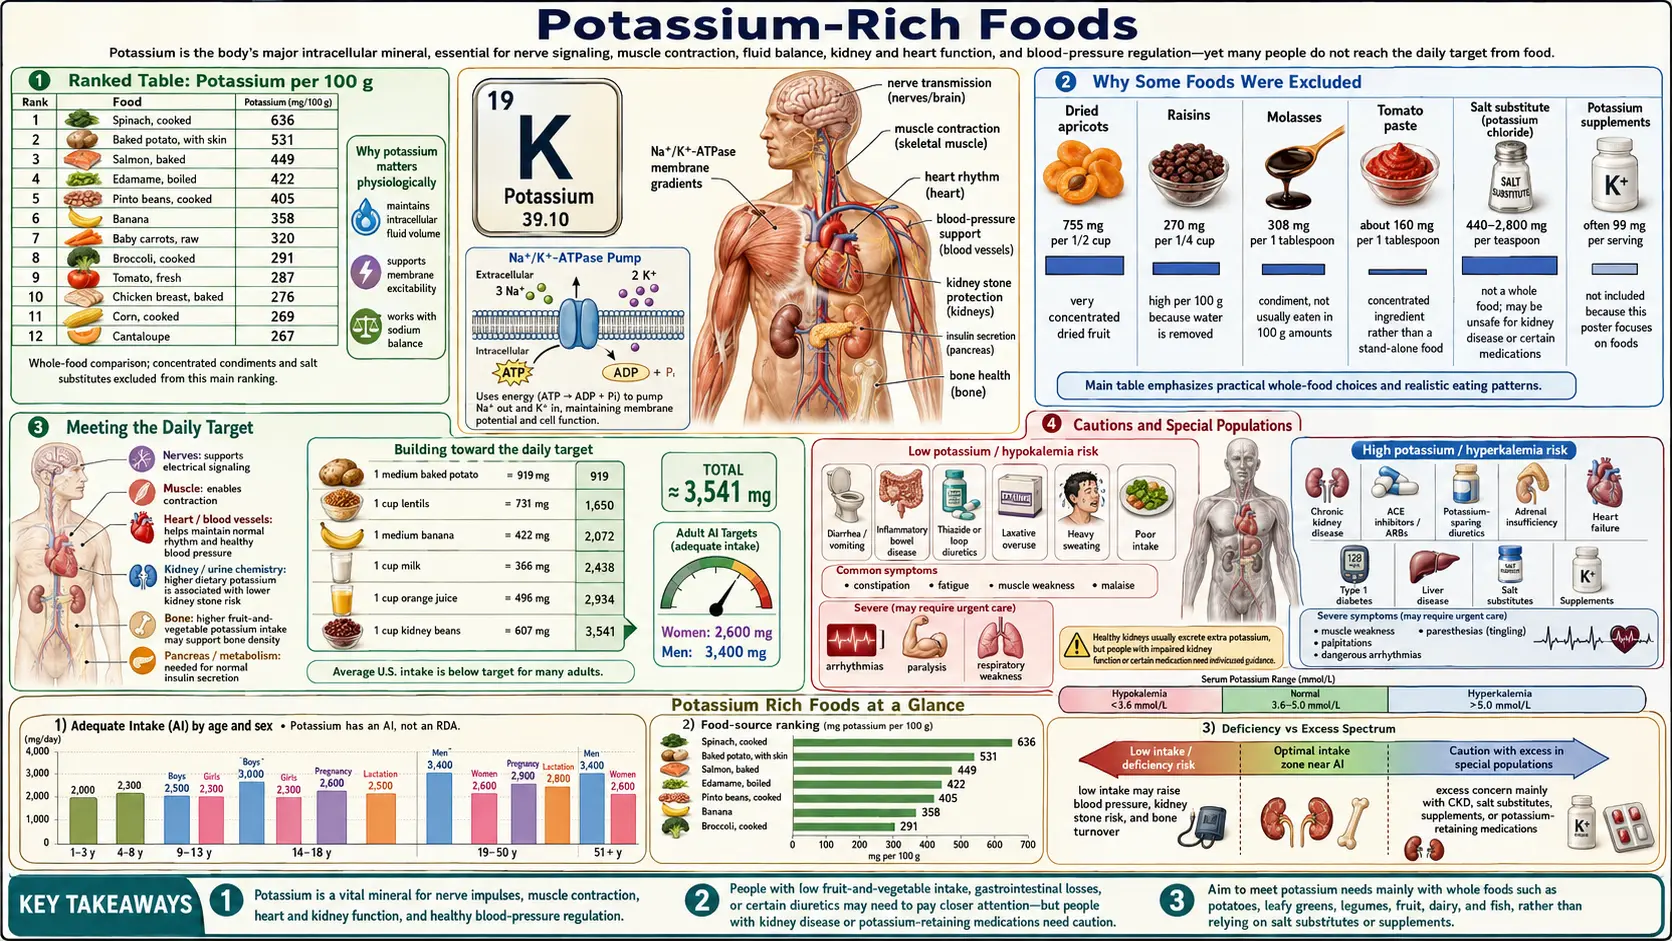
This page ranks common potassium-rich whole foods by their potassium density, expressed as milligrams of potassium per 100 g of edible food, alongside calorie density. The ranking deliberately excludes leafy vegetables, edamame, and baked white potato — foods that either skew per-100-g comparisons (raw leaves wilt down dramatically; baked potato density would dominate the list) or are not daily staples in most Western diets. The result is a practical shortlist for everyday meal planning, dominated by beans, root vegetables, fruits, and common produce, with rice rounded in at the bottom for context.
The U.S. National Academies of Sciences, Engineering, and Medicine (2019) set the Adequate Intake (AI) for adult potassium at 3,400 mg/day for men and 2,600 mg/day for women. Most Americans fall well short of these amounts. In whole foods, potassium arrives bundled with magnesium, fiber, polyphenols, and alkaline precursors that all contribute independently to blood-pressure, kidney, and bone health; a supplement supplies the potassium alone.
Interactive Visualization The Sodium–Potassium Pump — why you have a voltage Run the pump that gives every cell its charge — three sodium out, two potassium in, on Mg-ATP — then drop the magnesium and see exactly why low potassium refuses to correct. Launch →
Table of Contents
Ranked Table: Potassium per 100 g
| Rank | Food | Potassium / 100 g | Calories / 100 g |
|---|---|---|---|
| 1 | Yam, boiled | ~670 mg | ~116 kcal |
| 2 | White beans, cooked | ~561 mg | ~139 kcal |
| 3 | Avocado, raw | ~485 mg | ~160 kcal |
| 4 | Plantain, yellow, baked | ~477 mg | ~155 kcal |
| 5 | Sweet potato, baked in skin (flesh) | ~475 mg | ~90 kcal |
| 6 | Acorn squash, baked | ~437 mg | ~56 kcal |
| 7 | Pinto beans, cooked | ~436 mg | ~143 kcal |
| 8 | Salmon, sockeye, cooked | ~436 mg | ~156 kcal |
| 9 | Pork loin, cooked (lean) | ~423 mg | ~198 kcal |
| 10 | White potato, boiled with skin | ~379 mg | ~87 kcal |
| 11 | Lentils, cooked | ~369 mg | ~116 kcal |
| 12 | Banana | ~358 mg | ~89 kcal |
| 13 | White mushrooms | ~318 mg | ~22 kcal |
| 14 | Beef, ground (85% lean), patty, broiled | ~318 mg | ~250 kcal |
| 15 | Broccoli, cooked | ~293 mg | ~35 kcal |
| 16 | Cantaloupe | ~267 mg | ~34 kcal |
| 17 | Zucchini | ~261 mg | ~17 kcal |
| 18 | Celery | ~260 mg | ~16 kcal |
| 19 | Tomato | ~237 mg | ~18 kcal |
| 20 | Asparagus | ~202 mg | ~20 kcal |
| 21 | Orange | ~181 mg | ~47 kcal |
| 22 | Brown rice, long-grain, cooked | ~86 mg | ~123 kcal |
| 23 | White rice, long-grain, cooked (enriched) | ~35 mg | ~130 kcal |
A note on rice. Both varieties sit at the bottom of the ranking. Rice is a starchy staple, not a potassium source — cooked white rice delivers only ~35 mg per 100 g, and brown rice more than twice that at ~86 mg per 100 g. Brown rice retains more potassium because it keeps its bran and germ layers, where most of the mineral content lives; the milling that produces white rice strips those layers along with most of the magnesium, fiber, and B vitamins (enrichment restores some B vitamins and iron but not potassium). For perspective, USDA's 1-cup cooked serving weighs ~202 g for long-grain brown rice and ~158 g for long-grain white rice, which yields ~174 mg of potassium from brown rice and ~55 mg from white rice — less than half the ~422 mg in a medium banana. Beans, lentils, and the vegetables higher up this list supply far more potassium per serving.
How to Read This Table
Per-100-g density is the most honest way to compare foods, because it strips out portion-size noise. A medium banana (~118 g) provides roughly 422 mg of potassium — not because bananas are unusually concentrated, but because the portion is larger than 100 g. White beans are denser per gram than bananas, but you typically eat them in similar 1-cup portions (~180 g cooked), so a single serving of white beans delivers around 1,000 mg of potassium versus a banana's ~420 mg.
- Density vs. portion – A high mg/100 g number means each bite is rich in potassium. To translate to a real-world serving, multiply by the typical portion in grams divided by 100. A 200 g portion of cooked white beans yields roughly 1,120 mg of potassium.
- Calorie cost – Foods with low kcal/100 g (mushrooms, zucchini, celery, tomato, cucumber) let you accumulate potassium with minimal calorie intake. Useful for anyone managing weight while raising potassium intake.
- The values are approximate – The tilde symbol (~) reflects natural variation in the U.S. Department of Agriculture (USDA) FoodData Central database between cultivars, growing conditions, and preparation methods. Treat these as representative ballpark figures, not laboratory measurements of a specific food item in your kitchen.
Why Some Foods Were Excluded
The exclusions in this ranking are deliberate, not oversights. Each excluded category is worth understanding on its own terms.
- Leafy vegetables (spinach, Swiss chard, beet greens) – These pack roughly 379–762 mg of potassium per 100 g raw (USDA: Swiss chard 379 mg, spinach 558 mg, beet greens 762 mg; boiled, drained beet greens reach 909 mg), but raw leaves wilt down dramatically when cooked, so a "cup" of cooked spinach actually represents ~180 g of raw leaves. The per-100-g number is misleading without that context. Greens are still excellent potassium sources — they are just hard to compare apples-to-apples with denser whole foods.
- Edamame – Fresh shelled edamame supplies ~436 mg per 100 g, but is not a daily staple in most Western diets and would distort the practical-foods focus of this ranking.
- Baked white potato – A baked potato with skin delivers ~535 mg per 100 g, considerably more than the boiled version. It was excluded because it would otherwise dominate the top of the list and overshadow the diversity of other high-potassium choices. The boiled-with-skin entry (rank 10) preserves the potato's place without making the table monotone.
A note on avocado. Avocado was originally excluded from this list, but it has been added back at rank 3 because it is one of the few high-density potassium sources (~485 mg per 100 g) that is realistic for daily intake in a Western diet. Worth noting: at ~160 kcal per 100 g, avocado is roughly 7× the energy density of zucchini, so each 100 g of potassium from avocado costs more calories than from a low-energy vegetable. That trade is fine for most people — the calories are mostly monounsaturated fat with attached fiber, magnesium, and folate — but it matters for anyone tracking energy intake closely.
Meeting the Daily Target
Reaching 3,400 mg/day from these foods is straightforward when you stack two or three of them in a single day. Some illustrative combinations:
- Bean-forward day – 1.5 cups cooked white beans (~270 g, ~1,515 mg) + 1 medium baked sweet potato (~114 g, ~542 mg) + 1 banana (~120 g, ~430 mg) + 1 cup cooked broccoli (~150 g, ~440 mg) = ~2,930 mg, with the rest easily covered by tomato sauce, dairy, or fish.
- Lentil-forward day – 1.5 cups cooked lentils (~300 g, ~1,107 mg) + 1 cup boiled potatoes with skin (~150 g, ~570 mg) + 1 cup cantaloupe cubes (~160 g, ~427 mg) + 1 large orange (~180 g, ~325 mg) = ~2,430 mg, supplemented by zucchini, mushrooms, or celery in cooked dishes.
- Low-calorie pattern – A salad of celery, cucumber, tomato, and white mushrooms, plus a side of asparagus, can deliver 700–900 mg of potassium for under 200 kcal, leaving room for higher-density foods elsewhere.
Practically, two cups of legumes + one starchy vegetable + a piece of fruit reaches ~80% of the daily target without effort.
Cooking and Storage Effects
Potassium is water-soluble, so preparation method matters more than for many other minerals.
- Boiling leaches potassium – Boiling potatoes without the skin in a large volume of water can reduce potassium content by 30–50%. Boiling with skin, steaming, or microwaving preserves more potassium. The "boiled with skin" entry in the table reflects the better-retention version.
- Roasting and baking concentrate potassium – Because water evaporates rather than carrying potassium away, dry-heat methods preserve mineral content per gram of finished food. This is why USDA lists sweet potato baked in its skin at ~475 mg/100 g, higher than the raw root's ~337 mg/100 g.
- Skins matter – The skin of potatoes, cucumbers, and zucchini contains more potassium per gram than the flesh. Eating with the skin (well washed) materially increases intake.
- Canning losses – Canned vegetables in brine lose potassium to the liquid. Draining and rinsing further reduces sodium but also strips some potassium. Frozen, then briefly cooked, preserves mineral content best.
Cautions and Special Populations
For most healthy adults, increasing potassium from whole foods is unambiguously beneficial. There are, however, groups of people whose bodies clear potassium more slowly, so that potassium can build up in the blood (hyperkalemia).
- Chronic kidney disease (estimated glomerular filtration rate (eGFR) below 45 mL/min) – In chronic kidney disease (CKD), the kidneys clear potassium poorly, so potassium can build up in the blood to dangerous levels; a high-potassium menu adds to that load.
- RAAS-blocking medications – angiotensin-converting enzyme inhibitors (ACE inhibitors), angiotensin-receptor blockers, and potassium-sparing diuretics (spironolactone, eplerenone, amiloride) all reduce urinary potassium excretion. Most patients tolerate dietary potassium fine. The lisinopril (ACE inhibitor) label states that drugs acting on this hormone system can cause hyperkalemia, and lists kidney impairment, diabetes, potassium-sparing diuretics, potassium supplements and potassium-containing salt substitutes as risk factors.
- Type 2 diabetes – Insulin resistance can blunt cellular potassium uptake. This does not by itself make potassium-rich foods a problem — generally the opposite — but blood potassium results may behave differently than expected.
- Salt substitutes – Potassium chloride (sold as a salt substitute) delivers 500–650 mg of potassium per ¼ teaspoon. Adding it on top of a whole-foods potassium-rich diet can push intake to therapeutic levels appropriate for hypertensive patients but problematic for those with chronic kidney disease or on RAAS-blocking medications.
- Acute hyperkalemia symptoms – Muscle weakness, tingling (paresthesias), palpitations, or unexpected fatigue after a high-potassium meal can be signs of high blood potassium, which can disturb the heart's rhythm; a blood test measures it. These are uncommon outside the populations listed above.
This content is provided for informational purposes only and does not constitute medical advice. People with chronic kidney disease, people taking angiotensin-converting enzyme inhibitors, angiotensin receptor blockers (ARBs), or potassium-sparing diuretics, and anyone with a history of hyperkalemia are the groups in whom a major increase in potassium intake can push blood potassium too high.
Key Research Papers
Primary Data Sources
- USDA FoodData Central — Reference values for potassium and calorie content of all foods in the table.
- National Academies of Sciences, Engineering, and Medicine. Dietary Reference Intakes for Sodium and Potassium. Washington, DC: The National Academies Press; 2019.
- NIH Office of Dietary Supplements — Potassium Fact Sheet for Health Professionals.
Clinical and Population Evidence
- Appel LJ, Moore TJ, Obarzanek E, et al. A clinical trial of the effects of dietary patterns on blood pressure (DASH). New England Journal of Medicine. 1997;336(16):1117-1124. — doi:10.1056/NEJM199704173361601
- Aburto NJ, Hanson S, Gutierrez H, Hooper L, Elliott P, Cappuccio FP. Effect of increased potassium intake on cardiovascular risk factors and disease: systematic review and meta-analysis. BMJ. 2013;346:f1378. — doi:10.1136/bmj.f1378
- Neal B, Wu Y, Feng X, et al. Effect of salt substitution on cardiovascular events and death (SSaSS). New England Journal of Medicine. 2021;385(12):1067-1077. — doi:10.1056/NEJMoa2105675
PubMed Topic Searches
- PubMed: Dietary potassium intake and whole foods
- PubMed: Potassium content of legumes and vegetables
- PubMed: Cooking-method effects on potassium retention
- PubMed: DASH diet, potassium, and blood pressure
External Authoritative Resources
Connections
- All Minerals
- The Sodium–Potassium Pump — interactive animation
- Potassium
- Potassium Benefits Hub
- Potassium and Blood Pressure
- Potassium and Heart Rhythm
- Potassium and Muscle Function
- Avocado
- Bananas
- Lentils
- Magnesium
- Calcium
- Hypertension
- Atrial Fibrillation
- Kidney Disease
- Celery Juice
- Cramp Prevention
- Spinach
- Broccoli
- Heart Failure
- Nattokinase
- History
- Sources
- Deficiency
- Toxicity