Corn: Nutrient Profile
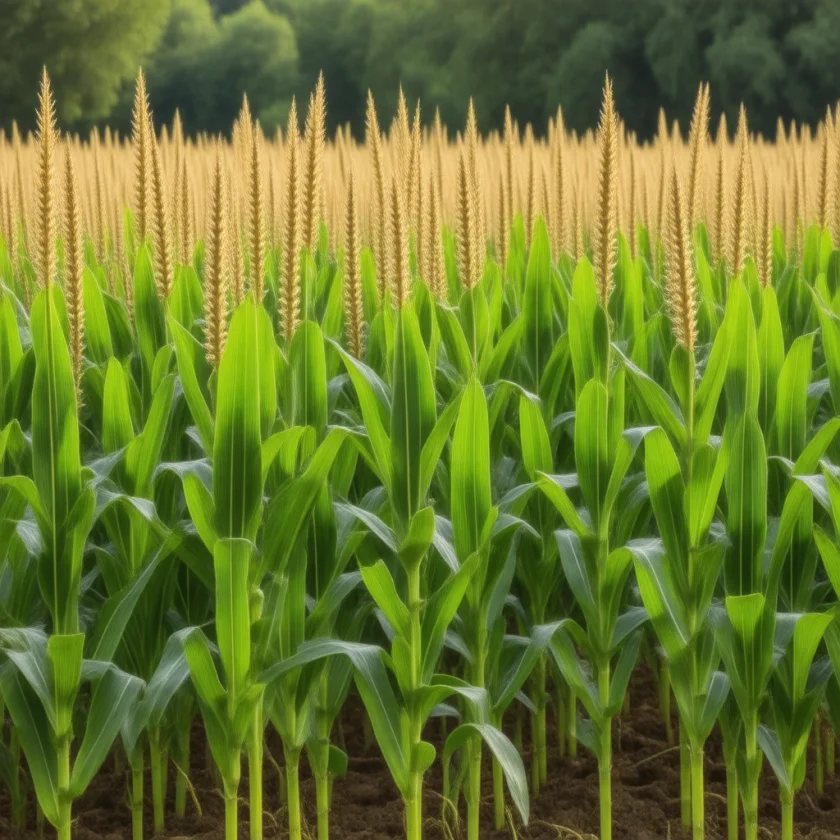
What is Corn richest in? Below are the vitamins, minerals and amino acids that 100 g of Corn delivers in the highest amounts. Each one links to that nutrient’s own page listing the best foods to get it from.
| Corn: Richest Nutrients (per 100 g) | ||||
|---|---|---|---|---|
| Rank | Nutrient | Per 100 g | %DV / 100g | Purpose |
| Vitamins | ||||
| 1 | Vitamin B6 | 0.6 mg | 🟡 37% | Brain & metabolism |
| 2 | Vitamin B1 (Thiamine) | 0.4 mg | 🟡 32% | Turns carbs into energy |
| 3 | Vitamin B3 (Niacin) | 3.6 mg | 🟡 23% | Energy, skin & nerves |
| 4 | Vitamin B2 (Riboflavin) | 0.2 mg | 🟡 15% | Energy & cell health |
| Minerals | ||||
| 1 | Copper | 0.3 mg | 🟡 35% | Iron use; connective tissue |
| 2 | Magnesium | 127 mg | 🟡 30% | Muscle, nerves & energy |
| 3 | Selenium | 16 mcg | 🟡 28% | Antioxidant & thyroid |
| 4 | Manganese | 0.5 mg | 🟡 21% | Bone & metabolism |
| 5 | Zinc | 2.2 mg | 🟡 20% | Immunity & healing |
| 6 | Phosphorus | 210 mg | 🟡 17% | Bones & cellular energy |
| 7 | Iron | 2.7 mg | 🟡 15% | Carries oxygen in blood |
| Amino Acids — ranked by amount (no Daily Value) | ||||
| 1 | Glutamic acid | 1.8 g | 🟢 | Brain signaling (glutamate) |
| 2 | Leucine | 1.2 g | 🟢 | Builds muscle (branched-chain amino acid, BCAA) |
| 3 | Proline | 0.8 g | 🟡 | Collagen & joints |
| 4 | Alanine | 0.7 g | 🟡 | Energy (glucose cycle) |
| 5 | Aspartic acid | 0.7 g | 🟡 | Cellular energy & detox |
| 6 | Valine | 0.5 g | 🟡 | Muscle & energy (branched-chain amino acid) |
| 7 | Arginine | 0.5 g | 🟡 | Blood flow (nitric oxide) |
| 8 | Phenylalanine | 0.5 g | 🟡 | Dopamine & focus |
| 9 | Serine | 0.4 g | 🟡 | Cell membranes & brain |
| 10 | Glycine | 0.4 g | 🟡 | Collagen, calm & sleep |
| 11 | Tyrosine | 0.4 g | 🟡 | Dopamine & thyroid |
| 12 | Threonine | 0.4 g | 🟡 | Collagen & gut lining |
| 13 | Isoleucine | 0.3 g | 🟡 | Muscle & energy (branched-chain amino acid) |
| 14 | Histidine | 0.3 g | 🟡 | Histamine & blood |
Values are per 100 g of the U.S. Department of Agriculture (USDA) FoodData Central record FDC 170288, “Corn grain, yellow” (SR Legacy). %DV is the amount per 100 g divided by the adult Daily Value in 21 CFR 101.9.
This USDA record is dry whole corn grain, with 10.4 g of water and 365 kcal per 100 g. Fresh sweet corn holds far more water and lower amounts of these nutrients: USDA FDC 169998, “Corn, sweet, yellow, raw” (76.0 g of water and 86 kcal per 100 g), lists 0.093 mg of vitamin B6, 37 mg of magnesium, 0.054 mg of copper, 0.6 µg of selenium and 0.46 mg of zinc per 100 g.
Niacin in corn depends on processing. A 2016 review of maize processing by Suri and Tanumihardjo reports that most B vitamins are lost during storage and milling, with further losses during soaking and cooking, but that “fermentation and nixtamalization (soaking in alkaline solution) can increase bioavailability of riboflavin and niacin.” For niacin, the review states, “processing is actually necessary for nutrient bioavailability” — so the niacin in the table is not all usable from corn that has not been processed this way. The same review reports that soaking, fermenting, cooking and nixtamalization can improve mineral bioavailability by reducing phytic acid, and that the vitamins and minerals found mainly in the germ are reduced when the germ is removed (degermination), while carotenoids, found mainly in the endosperm, become more concentrated. See Vitamin B3 (Niacin).
The amino acids corn lacks. Maize “lacks adequate amounts of the essential amino acids lysine and tryptophan,” according to a 2011 review by Nuss and Tanumihardjo; the USDA record lists 0.265 g of lysine and 0.067 g of tryptophan per 100 g, below the amino acids ranked in the table. The same review describes quality protein maize, a cultivar that represents nearly half a century of research, as having twice the lysine and tryptophan of traditional maize.
Corn’s eye pigments. The USDA record lists 1360 µg of lutein + zeaxanthin per 100 g of yellow corn grain. The pigment zeaxanthin takes its name from corn’s botanical name, Zea mays.
Key Research Papers
- Suri DJ, Tanumihardjo SA (2016). Effects of different processing methods on the micronutrient and phytochemical contents of maize: from A to Z. Comprehensive Reviews in Food Science and Food Safety 15(5):912-926 — PubMed PMID: 33401800
- Nuss ET, Tanumihardjo SA (2011). Quality protein maize for Africa: closing the protein inadequacy gap in vulnerable populations. Advances in Nutrition 2(3):217-224 — PubMed PMID: 22332054