Phosphorus: Food Sources & Daily Intake
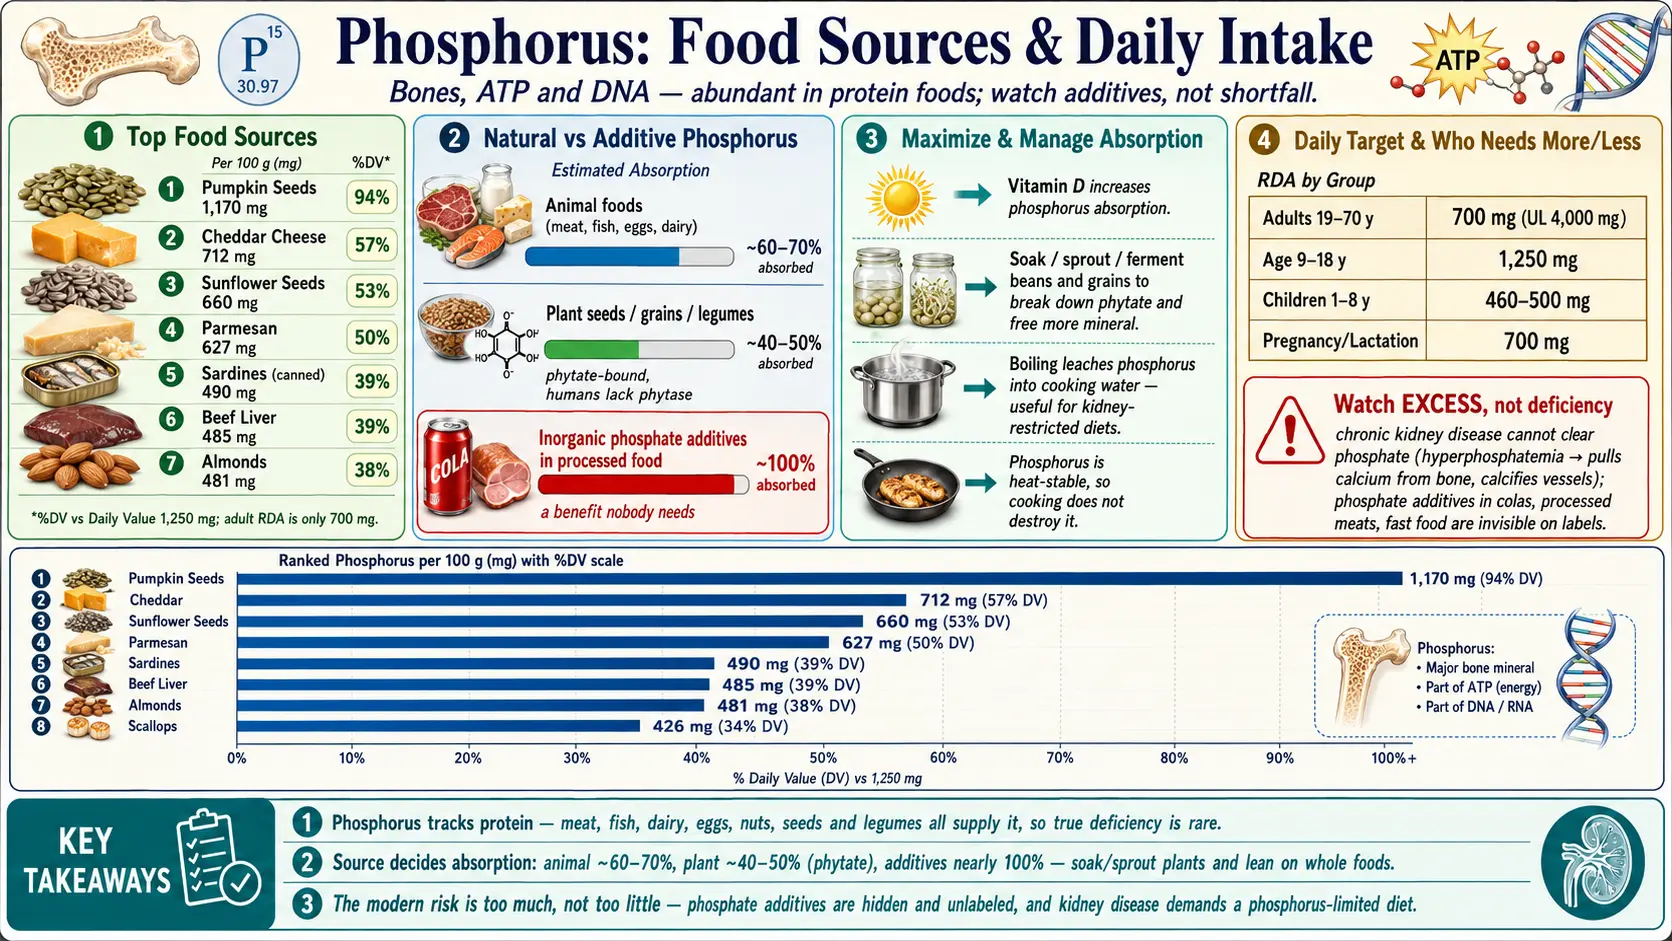
Phosphorus is the body’s second most abundant mineral after calcium, and the two work as a pair: about 85% of your phosphorus sits in bones and teeth as calcium-phosphate crystal, giving the skeleton its hardness. The rest is busy everywhere else — it forms the high-energy bonds of adenosine triphosphate (ATP) that power every cell, builds the backbone of DNA and RNA, makes up cell-membrane phospholipids, and buffers blood pH. Because it is built into all protein-rich tissue, phosphorus is plentiful in food: dairy, fish, meat, poultry, eggs, nuts, seeds and legumes are all strong natural sources, and a normal mixed diet easily meets the requirement.
| Phosphorus: Food Sources & Daily Intake | ||||||
|---|---|---|---|---|---|---|
| Rank | Food (serving) | Per 100 g | %DV / 100g | Glucose | Fructose | Notes |
| 1 | Pumpkin Seeds 1 oz / 28 g | 1,170 mg | 🟢 94% | 0.1 | 0.1 | Among the richest plant sources, though some is phytate-bound. |
| 2 | Sunflower Seeds 1 oz / 28 g | 660 mg | 🟢 53% | — | — | |
| 3 | Parmesan Cheese 1 oz / 28 g | 627 mg | 🟢 50% | 0 | 0 | Hard, aged cheeses are among the densest whole-food sources. |
| 4 | Sardines (Canned) 1 can / 92 g | 490 mg | 🟡 39% | 0 | 0 | The soft, edible bones add both phosphorus and calcium. |
| 5 | Beef Liver 3 oz / 85 g | 485 mg | 🟡 39% | 0 | 0 | An exceptional whole-food source, like most organ meats. |
| 6 | Almonds 1 oz / 28 g | 481 mg | 🟡 38% | 0.2 | 0.1 | |
| 7 | Cheddar Cheese 1 oz / 28 g | 455 mg | 🟡 36% | 0.3 | 0 | |
| 8 | Scallops 3 oz / 85 g | 426 mg | 🟡 34% | 0 | 0 | |
| 9 | Salmon ½ fillet / 154 g | 371 mg | 🟡 30% | — | — | |
| 10 | Beef Organ Meats 3 oz / 85 g | 304 mg | 🟡 24% | 0 | 0 | Nutrient-dense organ meat. |
| 11 | Chicken Organ Meats 3 oz / 85 g | 289 mg | 🟡 23% | 0 | 0 | Nutrient-dense organ meat (giblets). |
| 12 | Pork Organ Meats 3 oz / 85 g | 240 mg | 🟡 19% | — | — | Nutrient-dense organ meat. |
| 13 | Turkey 3 oz / 85 g | 230 mg | 🟡 18% | 0 | 0 | |
| 14 | Beef Meat 3 oz / 85 g | 224 mg | 🟡 18% | 0 | 0 | |
| 15 | Pork 3 oz / 85 g | 223 mg | 🟡 18% | 0 | 0 | |
| 16 | Milk (Whole) 1 cup / 244 g | 84 mg | ⚪ 7% | 0 | 0 | |
| 17 | Brown Rice 1 cup / 195 g | 103 mg | ⚪ 8% | 0 | 0 | Common staple. |
Table of Contents
How to Read These Tables
- Abundant in protein foods. Phosphorus tracks protein closely — if a food is high in protein (meat, fish, dairy, eggs, beans, nuts), it is almost always high in phosphorus. This is why outright deficiency is rare in people who eat enough food.
- %DV vs Recommended Dietary Allowance (RDA). The %DV column compares 100 g of each food against the U.S. Food and Drug Administration (FDA) Daily Value of 1,250 mg, set in the FDA’s 2016 food-label rule; it matches the requirement for ages 9–18 in the table below, the highest of any age group. Your actual physiological target (the Recommended Dietary Allowance) is only 700 mg for adults, so many foods will look modest against the Daily Value (DV) yet still cover a real day’s need quickly.
- Watch the upper limit, not just the floor. For most minerals the concern is getting enough; with phosphorus the more common modern issue is getting too much from phosphate additives in processed food. The second table lists the Tolerable Upper Intake Level (UL) for each life stage.
Recommended Intakes & Upper Limits
Your personal target depends on age, sex and pregnancy. The Daily Value used for the %DV column above is a single label figure; the table below is the age-specific guidance.
| Life stage | Recommended Dietary Allowance / Adequate Intake (mg/day) | Upper limit (mg/day) |
|---|---|---|
| Infants 0–6 mo | 100* (Adequate Intake) | Not set |
| Infants 7–12 mo | 275* (Adequate Intake) | Not set |
| Children 1–3 y | 460 | 3,000 |
| Children 4–8 y | 500 | 3,000 |
| Children 9–13 y | 1,250 | 4,000 |
| Adolescents 14–18 y | 1,250 | 4,000 |
| Adults 19–70 y | 700 | 4,000 |
| Adults 71+ y | 700 | 3,000 |
| Pregnancy | 700 (1,250 if ≤18 y) | 3,500 |
| Lactation | 700 (1,250 if ≤18 y) | 4,000 |
Bioavailability & Absorption
How much phosphorus you actually absorb depends heavily on its source. Phosphorus from animal foods (meat, fish, eggs, dairy) is well absorbed — roughly 60–70%. Phosphorus in plant seeds, grains, nuts and legumes is largely stored as phytate (phytic acid), and humans lack the enzyme phytase to break it down, so only about 40–50% is available. The most absorbable form of all is the inorganic phosphate added to processed foods, which is nearly 100% absorbed — a benefit nobody needs and a real concern for anyone on a phosphorus-restricted diet. Vitamin D increases phosphorus absorption, which is one reason the two are discussed together.
A 2010 review of diet in kidney disease explains why the number on a label can mislead: phosphorus bound as phytate in seeds and legumes is less well absorbed, inorganic phosphate from additives in processed, preserved or “enhanced” foods and soft drinks is absorbed more readily, and additive phosphorus may be under-reported in nutrient databases and not told apart from the less absorbable natural kind. Because protein and phosphorus go together, the authors also compare foods by their phosphorus-to-protein ratio (Kalantar-Zadeh et al., 2010).
Cooking & Storage
Phosphorus is a chemically stable mineral — it is not destroyed by heat, light or air the way fragile vitamins are, so ordinary cooking does not lower the phosphorus content of a food. Some can leach into cooking water when foods are boiled, which is one of the few practical levers people on a phosphorus-restricted diet use (boiling and discarding the water modestly reduces the amount in vegetables and meats). For everyone else, soaking and cooking beans, lentils and grains is helpful in the opposite direction: it begins to break down phytate and makes the plant phosphorus a little more available.
Vegetarian & Vegan Sources
Plant-based eaters have plenty of phosphorus sources — legumes, nuts, seeds and whole grains are all rich, and dairy and eggs add more for vegetarians. The catch is absorption: much of the phosphorus in plant seeds is locked in phytate and only partly available, so the figure on a label overstates what you take up. In practice this is rarely a problem because the requirement is easy to reach, and soaking, sprouting, fermenting and cooking these foods releases more of the mineral. Anyone eating a varied plant diet with adequate protein meets the need comfortably. Two legumes not shown in the table above: USDA FoodData Central lists cooked lentils at 180 mg and cooked black beans at 140 mg of phosphorus per 100 g. Tempeh, natto and miso are fermented soy foods.
Who Needs to Pay Attention
Dietary deficiency is rare in healthy people because phosphorus is so widespread; true depletion is seen mainly with severe malnutrition, chronic heavy alcohol use, refeeding syndrome, or certain medications and absorption disorders, and causes weakness, bone pain and appetite loss. For most readers the more relevant issue is excess. Phosphate additives — used in colas, processed meats, fast food, baked goods and many packaged products — are nearly fully absorbed and are a large, often invisible source that does not appear on nutrition labels. The group most affected is people with chronic kidney disease: failing kidneys cannot clear phosphorus, so it builds up in the blood (hyperphosphatemia), pulling calcium from bone and calcifying blood vessels. Kidney patients are routinely advised to limit phosphorus, favor whole foods over additive-laden processed ones, and work with a renal dietitian. Reducing dietary phosphorus is considered a cornerstone of managing high blood phosphorus in kidney disease, and additives are a hidden source: in a 2026 study in which 13 adults with chronic kidney disease collected 4 weeks of grocery receipts, about a third of the 429 processed foods they bought carried a phosphorus additive (28.0% phosphorus additives only and 7.9% both potassium and phosphorus additives), most often lecithin, and mostly in snacks and ready-to-eat foods; many deli and bakery items carried no label to check (Tailor et al., 2026).
Key Research Papers
- NIH Office of Dietary Supplements — Phosphorus Fact Sheet (RDA, AI, UL)
- Linus Pauling Institute — Phosphorus Micronutrient Information Center
- PubMed — dietary phosphorus bioavailability, phosphate additives and absorption. — Search PubMed
- Tailor PK, Lee ASY, Picard K (2026). Searching for Hidden Sources of Potassium and Phosphorus Additives in Adults Living With Chronic Kidney Disease. Seminars in Nephrology:151733. — PubMed PMID: 42850176
- Kalantar-Zadeh K, Gutekunst L, Mehrotra R, Kovesdy CP, Bross R, Shinaberger CS, Noori N, Hirschberg R, Benner D, Nissenson AR, Kopple JD (2010). Understanding sources of dietary phosphorus in the treatment of patients with chronic kidney disease. Clinical Journal of the American Society of Nephrology;5(3):519-30. — PubMed PMID: 20093346