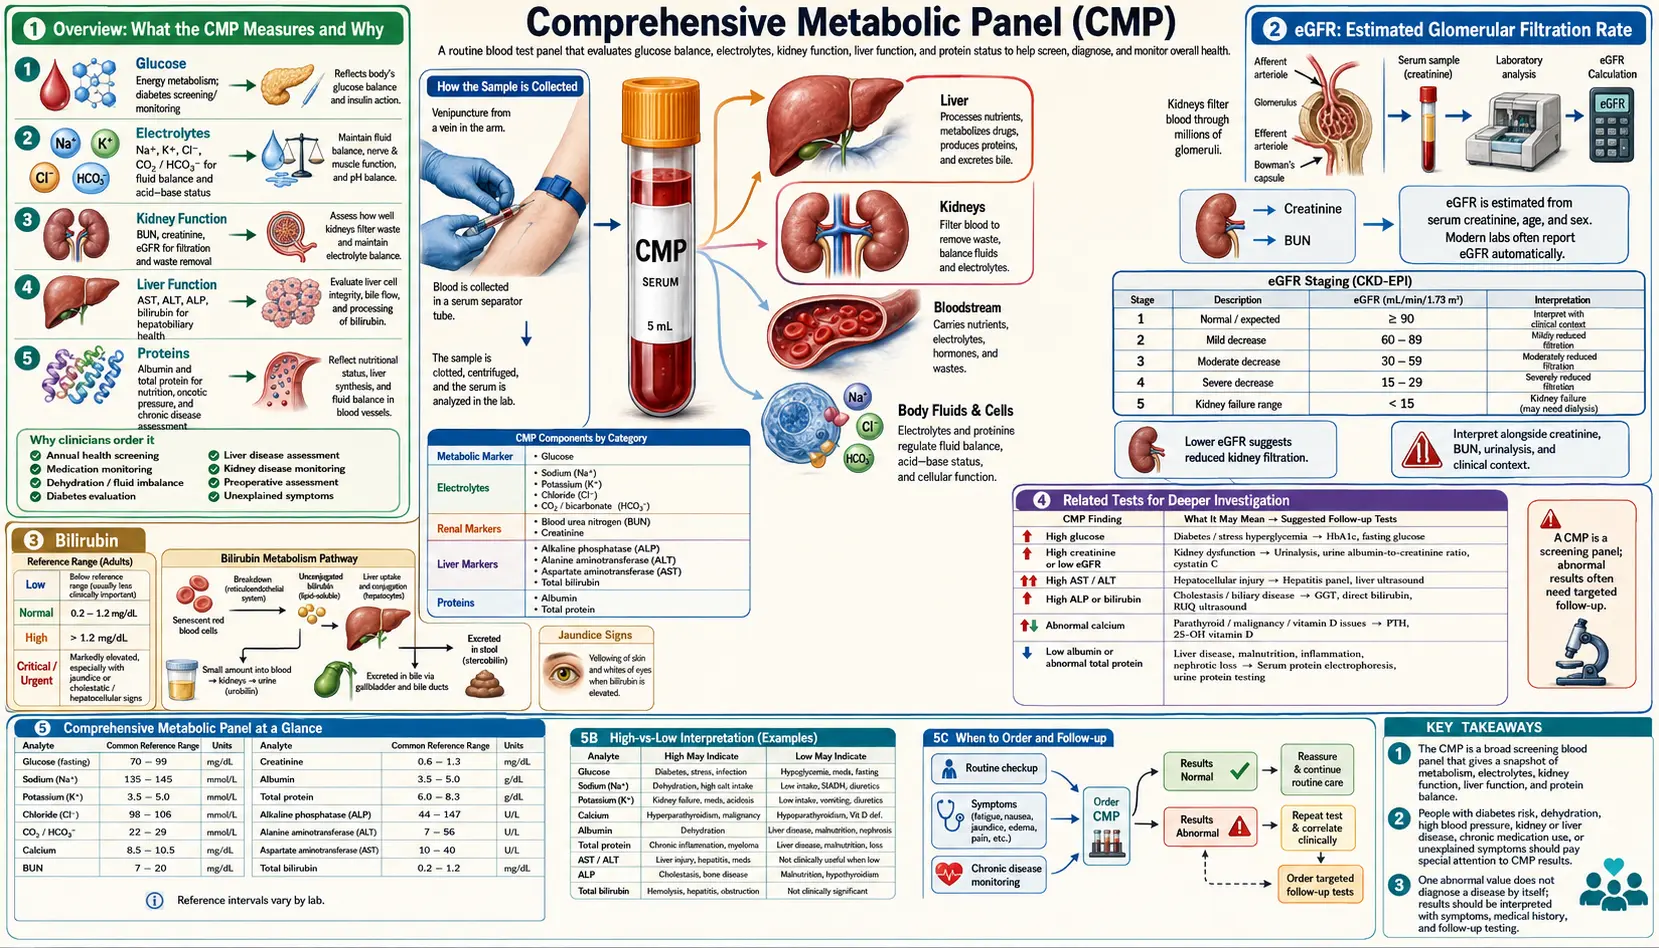
Comprehensive Metabolic Panel (CMP)
Table of Contents
- Overview: What the CMP Measures and Why
- Glucose (Blood Sugar)
- BUN and Creatinine: Kidney Function Markers
- BUN/Creatinine Ratio
- eGFR: Estimated Glomerular Filtration Rate
- Electrolytes: Sodium, Potassium, Chloride, and CO2
- Calcium
- Liver Enzymes: AST, ALT, and ALP
- Total Protein and Albumin
- Bilirubin
- Common Patterns Seen on a CMP
- Diet, Lifestyle and Supplement Research Related to CMP Markers
- Repeat Testing
- Related Tests
- Key Research Papers
- Connections
- Featured Videos
Overview: What the CMP Measures and Why
The Comprehensive Metabolic Panel (CMP) is a routine blood test that measures 14 different substances in one blood sample. It gives information about metabolism and the balance of certain chemicals in the body, and MedlinePlus describes it as commonly used as part of a routine checkup, to help diagnose the cause of symptoms, to guide treatment, and to check whether a treatment is working or causing side effects. Other names include chem 14, chemistry panel, chemistry screen, and metabolic panel (MedlinePlus).
The 14 measured tests in a standard CMP are listed below. Most laboratories also report an eGFR, which is not a separate measurement: it is calculated from the creatinine result.
- Glucose (blood sugar)
- BUN (blood urea nitrogen)
- Creatinine
- Sodium
- Potassium
- Chloride
- CO2 / Bicarbonate
- Calcium
- AST (aspartate aminotransferase)
- ALT (alanine aminotransferase)
- ALP (alkaline phosphatase)
- Total Protein
- Albumin
- Bilirubin (total)
Calculated from the creatinine result: eGFR (estimated glomerular filtration rate). A basic metabolic panel (BMP) includes 8 of the 14 tests; it leaves out total protein, albumin, bilirubin, and the liver enzymes ALP, ALT, and AST (MedlinePlus).
About the ranges on this page. Unless another source is named, each range below is the example normal range given in the MedlinePlus Medical Encyclopedia article on the comprehensive metabolic panel (U.S. National Library of Medicine). MedlinePlus notes that normal value ranges may vary slightly among laboratories, that some labs use different measurements or test different specimens, and that normal values for creatinine can vary with age; a result is read against the range printed on the report from the laboratory that ran it. A laboratory reference interval describes the typical distribution of results in a healthy reference population, and a result outside it does not necessarily indicate disease; a clinical decision limit, by contrast, is tied to the risk of a specific outcome (Ozarda 2018, for the IFCC Committee on Reference Intervals and Decision Limits). The diabetes and kidney-disease thresholds given below are decision limits of this second kind.
Some functional-medicine practitioners describe narrower “functional” or “optimal” ranges for CMP markers. These ranges differ from one practitioner to another, and none of the sources cited on this page defines them, so they are not listed here.
Fasting. The MedlinePlus test page says a person may need to fast (not eat or drink) for several hours before a CMP; the MedlinePlus encyclopedia article says not to eat or drink for at least 8 hours. A fasting blood glucose result is defined by MedlinePlus as one taken after at least 8 hours without food or drink other than water.
Glucose (Blood Sugar)
Glucose is the body’s main source of energy (MedlinePlus). On a fasting sample it reflects how well blood sugar is regulated overnight, and it is one of the tests used to screen for prediabetes and diabetes.
MedlinePlus example range: 70 to 100 mg/dL (3.9 to 5.6 mmol/L).
Diagnostic thresholds (fasting plasma glucose): the American Diabetes Association’s Standards of Care classify 100 to 125 mg/dL as prediabetes (impaired fasting glucose) and 126 mg/dL or higher as diabetes; in the absence of unequivocal hyperglycemia the diagnosis requires two abnormal results, from the same sample or from two separate samples (ADA 2026).
Causes of High Values
- Insulin resistance or metabolic syndrome
- Prediabetes or type 2 diabetes
- High cortisol, as in Cushing syndrome or physical stress, which raises glucose output
- A non-fasting sample taken after eating
- Pancreatic disease
- Certain medications such as corticosteroids or thiazide diuretics
Causes of Low Values
- Adrenal insufficiency
- Inadequate caloric intake or prolonged fasting
- Liver disease impairing glycogen storage and gluconeogenesis
- Excessive insulin production (insulinoma, rare)
BUN and Creatinine: Kidney Function Markers
BUN (Blood Urea Nitrogen) measures the amount of urea nitrogen in the blood. Urea is a waste product created when the liver breaks down protein. The kidneys filter urea from the blood, so elevated BUN can indicate impaired kidney filtration. However, BUN is also influenced by protein intake, hydration status, and liver function.
MedlinePlus example BUN range: 6 to 20 mg/dL (2.14 to 7.14 mmol/L).
Causes of High BUN
- Dehydration (one of the most common causes)
- Kidney dysfunction or kidney disease
- High protein intake
- Upper gastrointestinal bleeding (blood is digested as protein)
- Congestive heart failure reducing renal blood flow
- Catabolic states such as severe infection or burns
Causes of Low BUN
- Low protein intake or protein malabsorption
- Liver disease impairing urea synthesis
- Overhydration
- Celiac disease or other malabsorptive conditions
Creatinine is a waste product of creatine phosphate metabolism in muscle tissue. It is produced at a relatively constant rate and is filtered by the kidneys. Creatinine is considered a more reliable marker of kidney function than BUN because it is less influenced by diet and hydration, although muscle mass, age, sex, cooked meat, and creatine supplements all affect it (see the Creatinine page).
MedlinePlus example creatinine range: 0.6 to 1.3 mg/dL (53 to 114.9 µmol/L) in the CMP article; the MedlinePlus creatinine test page gives separate ranges for men and women (shown on the Creatinine page in this section).
Causes of High Creatinine
- Impaired kidney filtration or chronic kidney disease
- Dehydration
- High muscle mass (can physiologically elevate creatinine)
- Creatine supplements, which raise serum creatinine without a change in filtration
- Rhabdomyolysis (muscle breakdown)
Causes of Low Creatinine
- Low muscle mass or muscle wasting
- Malnutrition
- Advanced liver disease
- Pregnancy (due to increased renal blood flow)
BUN/Creatinine Ratio
The BUN/creatinine ratio is a calculated value that helps differentiate between causes of elevated BUN. It provides additional context beyond the individual values. It is not one of the 14 measured tests, and laboratories that report it use their own reference values.
Commonly cited range: about 10:1 to 20:1.
Interpreting the Ratio
- Elevated ratio (greater than 20:1): Suggests pre-renal causes such as dehydration, high protein diet, gastrointestinal bleeding, or congestive heart failure. The kidneys themselves may be functioning normally, but reduced blood flow or increased urea production is driving BUN disproportionately higher than creatinine.
- Low ratio (less than 10:1): May indicate liver disease (reduced urea production), low protein intake, malnutrition, or rhabdomyolysis (creatinine rises disproportionately from muscle damage).
- Both BUN and creatinine elevated with a normal ratio: Suggests intrinsic kidney disease where both markers rise in proportion.
Because dehydration raises BUN more than creatinine, hydration status is one of the first explanations considered for a high ratio when kidney function is otherwise normal.
eGFR: Estimated Glomerular Filtration Rate
The eGFR is not directly measured but calculated from serum creatinine, age, and sex using a standardized formula. The 2021 CKD-EPI creatinine equation does this without the race term used in earlier versions (Inker 2021), and the NKF-ASN Task Force on Reassessing the Inclusion of Race in Diagnosing Kidney Disease recommended its immediate adoption by U.S. laboratories (Delgado 2022). eGFR estimates how well the kidneys are filtering blood and is used together with urine albumin to classify chronic kidney disease (KDIGO 2024).
KDIGO 2024 GFR categories (mL/min/1.73 m2):
- G1 — 90 or above: Normal or high
- G2 — 60 to 89: Mildly decreased
- G3a — 45 to 59: Mildly to moderately decreased
- G3b — 30 to 44: Moderately to severely decreased
- G4 — 15 to 29: Severely decreased
- G5 — less than 15: Kidney failure
KDIGO defines chronic kidney disease as abnormalities of kidney structure or function present for at least 3 months. In categories G1 and G2, the eGFR alone does not meet that definition; CKD is diagnosed there only when there is another marker of kidney damage, such as albumin in the urine (KDIGO 2024).
eGFR has limitations. A creatinine-based estimate can underestimate kidney function in people with high muscle mass and overestimate it in those with low muscle mass or advanced age. A single low eGFR reading does not by itself establish chronic kidney disease, because the definition requires the abnormality to persist for 3 months or more.
Causes of Low eGFR
- Chronic kidney disease at various stages
- Acute kidney injury
- Reduced renal blood flow from dehydration or heart failure
- Nephrotoxic medications — the KDIGO 2024 guideline’s examples include NSAIDs and certain antibiotics
- Long-standing hypertension or diabetes damaging the nephrons
Electrolytes: Sodium, Potassium, Chloride, and CO2
Sodium, potassium, bicarbonate, and chloride are electrolytes, electrically charged minerals that help control the amount of fluid in the body and the balance of acids and bases (MedlinePlus). They also take part in nerve conduction and muscle contraction.
Sodium
MedlinePlus example range: 135 to 145 mEq/L (135 to 145 mmol/L)
- High sodium (hypernatremia): Dehydration, excessive sodium intake, diabetes insipidus, Cushing syndrome, or certain medications.
- Low sodium (hyponatremia): Overhydration, SIADH (syndrome of inappropriate antidiuretic hormone), adrenal insufficiency, diuretic use, excessive sweating with water-only replacement, hypothyroidism, or liver cirrhosis.
Potassium
MedlinePlus example range: 3.7 to 5.2 mEq/L (3.70 to 5.20 mmol/L)
- High potassium (hyperkalemia): Kidney disease, adrenal insufficiency, metabolic acidosis, hemolysis during blood draw (a common false elevation), excessive supplementation, ACE inhibitors or potassium-sparing diuretics.
- Low potassium (hypokalemia): Diuretic use, chronic diarrhea or vomiting, low dietary intake, excessive aldosterone production, magnesium deficiency (magnesium is required for potassium retention), insulin administration, or alkalosis.
Chloride
MedlinePlus example range: 96 to 106 mEq/L (96 to 106 mmol/L)
- High chloride (hyperchloremia): Dehydration, metabolic acidosis (non-anion gap), excessive saline infusion, renal tubular acidosis, or diarrhea with bicarbonate loss.
- Low chloride (hypochloremia): Vomiting (loss of hydrochloric acid), metabolic alkalosis, SIADH, Addison disease, or chronic respiratory acidosis with compensation.
CO2 / Bicarbonate
MedlinePlus example range: 23 to 29 mEq/L (23 to 29 mmol/L)
- High CO2: Metabolic alkalosis (often from vomiting, antacid overuse, or hypokalemia), chronic respiratory acidosis with renal compensation (as in COPD).
- Low CO2: Metabolic acidosis (diabetic ketoacidosis, lactic acidosis, renal failure, diarrhea), chronic hyperventilation, or respiratory alkalosis.
Electrolyte imbalances rarely occur in isolation. Evaluating sodium, potassium, chloride, and CO2 together as a pattern provides far more clinical insight than looking at any single value.
Calcium
The CMP measures total serum calcium, which includes both free (ionized) calcium and calcium bound to proteins, primarily albumin. Calcium plays essential roles in bone health, muscle contraction, nerve signaling, blood clotting, and enzyme function.
MedlinePlus example range: 8.5 to 10.2 mg/dL (2.13 to 2.55 mmol/L) in the CMP article; the MedlinePlus calcium blood test article gives 8.8 to 10.3 mg/dL, which shows how much ranges differ between sources.
Because much of the calcium in blood is carried on albumin, the total calcium value is read alongside albumin: when albumin is low, total calcium can appear low even if ionized calcium is normal, and abnormal albumin or immunoglobulin levels are among the reasons MedlinePlus gives for measuring ionized calcium directly. In 1973 Payne and colleagues derived an albumin-adjusted calcium from 200 laboratory specimens: adjusted calcium = calcium − albumin + 4.0 (calcium in mg/100 mL, albumin in g/100 mL) (Payne 1973); other versions of the formula use different factors. In a later study of 210 hospitalized patients, adjusting total calcium for albumin or protein did not improve, and sometimes reduced, agreement with ionized calcium, and the authors argued against using adjusted calcium in that setting (Alhenc-Gelas 2022).
Causes of High Calcium
- Primary hyperparathyroidism (the most common cause of persistent mild hypercalcemia)
- Malignancy (certain cancers produce PTH-related peptide)
- Excessive vitamin D supplementation
- Granulomatous diseases (sarcoidosis, tuberculosis)
- Thiazide diuretic use
- Prolonged immobilization causing bone resorption
Causes of Low Calcium
- Vitamin D deficiency
- Hypoparathyroidism
- Magnesium deficiency (magnesium is needed for PTH secretion)
- Chronic kidney disease (impaired vitamin D activation)
- Malabsorption syndromes
- Low albumin (pseudohypocalcemia, in which ionized calcium is normal)
Liver Enzymes: AST, ALT, and ALP
ALP, ALT, and AST are enzymes mainly made in the liver (MedlinePlus). Together with bilirubin they are the most commonly ordered liver chemistries. The American College of Gastroenterology’s 2017 guideline notes that they are better termed “liver chemistries” or “liver tests” than “liver function tests” (Kwo 2017): AST and ALT mainly reflect liver-cell injury, while albumin and bilirubin reflect what the liver makes and clears.
AST (Aspartate Aminotransferase)
MedlinePlus example range: 8 to 33 U/L (0.13 to 0.55 µkat/L)
AST is found in the liver, heart, skeletal muscle, kidneys, and red blood cells. Because it is present in multiple tissues, an elevated AST is not specific to the liver. Strenuous exercise, heart damage, muscle injury, and hemolysis can all raise AST.
ALT (Alanine Aminotransferase)
MedlinePlus example range: 4 to 36 U/L (0.07 to 0.60 µkat/L)
ALT is more liver-specific than AST and is considered the better marker for hepatocellular injury. The ACG guideline states that elevated ALT has been associated with increased liver-related mortality in multiple studies, and that a true healthy normal ALT level ranges from 29 to 33 IU/L for males and 19 to 25 IU/L for females, with levels above this to be assessed (Kwo 2017) — lower than the upper limits many laboratories print.
Interpreting AST and ALT Together
- Both mildly elevated: Metabolic dysfunction-associated steatotic liver disease (MASLD, formerly called non-alcoholic fatty liver disease or NAFLD), medication effects, chronic viral hepatitis, or metabolic syndrome.
- AST greater than ALT (ratio greater than 2:1): Suggests alcoholic liver disease or advanced liver fibrosis/cirrhosis.
- ALT greater than AST: More common in MASLD, acute viral hepatitis, or drug-induced liver injury.
- Very low AST and ALT: May indicate vitamin B6 deficiency (B6, as pyridoxal phosphate, is a cofactor for both enzymes) or poor overall protein status.
ALP (Alkaline Phosphatase)
MedlinePlus example range: 20 to 130 U/L (0.33 to 2.17 µkat/L)
ALP is found primarily in the liver and bone, with smaller amounts in the intestines, kidneys, and placenta. It is a marker of biliary function and bone turnover. The ACG guideline defines cholestatic injury as a disproportionate rise in ALP compared with AST and ALT, and hepatocellular injury as the reverse (Kwo 2017).
- High ALP: Biliary obstruction, cholestasis, bone disorders (Paget disease, fracture healing, growing children), pregnancy, or vitamin D deficiency stimulating bone turnover.
- Low ALP: MedlinePlus describes low ALP as less common than high ALP and lists zinc deficiency (zinc is a cofactor for ALP), protein deficiency, malnutrition, pernicious anemia, thyroid disease, Wilson disease, and hypophosphatasia, a rare genetic disease, among the possible causes.
Total Protein and Albumin
Total protein measures the combined amount of albumin and globulins in the blood. Albumin, made in the liver, is the main protein in blood (MedlinePlus) and serves as a marker of nutritional status, liver synthetic function, and inflammatory burden.
Total Protein
MedlinePlus example range: 6.0 to 8.3 g/dL (60 to 83 g/L)
- High total protein: Chronic inflammation, chronic infections (MedlinePlus names HIV and viral hepatitis), multiple myeloma or other gammopathies, dehydration (hemoconcentration).
- Low total protein: Malnutrition, malabsorption, liver disease (reduced albumin production), kidney disease including nephrotic syndrome (protein loss in urine), chronic illness, or inflammatory states where albumin drops as a negative acute-phase reactant.
Albumin
MedlinePlus example range: 3.4 to 5.4 g/dL (34 to 54 g/L)
- High albumin: Typically indicates dehydration rather than overproduction.
- Low albumin: Chronic inflammation (albumin is a negative acute-phase reactant and drops during inflammatory states), liver disease, malnutrition, nephrotic syndrome, protein-losing enteropathy, or burns.
The globulin fraction can be estimated by subtracting albumin from total protein. The albumin/globulin ratio (A/G ratio) compares the two; MedlinePlus lists an autoimmune disease such as lupus, liver disease including cirrhosis, and kidney disease as possible causes of a low A/G ratio, and certain genetic disorders and leukemia as possible causes of a high one.
Bilirubin
Total bilirubin measures the combined amount of unconjugated (indirect) and conjugated (direct) bilirubin in the blood. Bilirubin is a yellow pigment produced from the breakdown of hemoglobin in aging red blood cells. The liver conjugates bilirubin to make it water-soluble for excretion in bile. Most bilirubin circulates unconjugated, and an elevated conjugated bilirubin implies hepatocellular disease or cholestasis (Kwo 2017).
MedlinePlus example range: 0.1 to 1.2 mg/dL (2 to 21 µmol/L)
Causes of High Bilirubin
- Gilbert syndrome: A common inherited condition, estimated by MedlinePlus Genetics to affect 3 to 7 percent of Americans, caused by changes in the UGT1A1 gene. It produces mild unconjugated hyperbilirubinemia that can rise with dehydration, fasting, illness, vigorous exercise, or menstruation; MedlinePlus Genetics notes that about 30 percent of people with it have no signs or symptoms and are found only when routine blood tests show elevated unconjugated bilirubin.
- Hemolytic anemia: Increased red blood cell destruction producing excess unconjugated bilirubin.
- Liver disease: Hepatitis, cirrhosis, or drug-induced liver injury impairing conjugation.
- Biliary obstruction: Gallstones or tumors blocking bile flow, elevating conjugated bilirubin.
- Ineffective erythropoiesis: Conditions such as vitamin B12 or folate deficiency where red blood cell precursors are destroyed before maturing.
Low Bilirubin
- Low bilirubin is generally not treated as clinically significant. Bilirubin has antioxidant properties, and observational studies link lower levels with higher disease risk: in a UK primary-care cohort of 504,206 adults with no hepatobiliary or hemolytic disease, relatively higher bilirubin within the normal range was associated with lower rates of lung cancer, COPD, and all-cause mortality (Horsfall 2011). These are associations, not evidence that raising bilirubin changes risk.
Serum bilirubin has been inversely related to cardiovascular disease in retrospective and prospective studies, and a review discusses prospective studies of cardiovascular risk in people with Gilbert syndrome and the related UGT1A1*28 allele (Schwertner 2008). These findings are observational.
Common Patterns Seen on a CMP
One of the advantages of the CMP is that several markers can be read together. Isolated abnormalities may not tell the full story, and patterns across markers give additional clues.
Prediabetic Pattern
- Fasting glucose of 100 to 125 mg/dL (the ADA prediabetes range)
- Mildly elevated ALT (fatty liver associated with insulin resistance)
- Elevated triglycerides if a lipid panel is run alongside
In the Diabetes Prevention Program trial (3,234 adults with elevated fasting and post-load glucose, average follow-up 2.8 years), a lifestyle program with goals of at least 7 percent weight loss and at least 150 minutes of physical activity a week reduced the incidence of type 2 diabetes by 58 percent compared with placebo; metformin reduced it by 31 percent (Knowler 2002).
Dehydration Pattern
- Elevated BUN with normal or mildly elevated creatinine
- BUN/creatinine ratio greater than 20:1
- High-normal or elevated sodium
- Elevated total protein and albumin (hemoconcentration)
- Elevated chloride
- Elevated calcium (concentrated in low-volume blood)
Dehydration can shift several CMP values at once, so hydration status at the time of the draw is part of interpreting them.
Liver Stress Pattern
- Elevated ALT, with or without elevated AST
- Elevated ALP if biliary involvement is present
- Elevated bilirubin
- Low albumin if liver synthetic function is compromised
- Low BUN if urea cycle function is impaired
- Elevated globulin (immune activation common in liver disease)
Mild AST and ALT elevations are commonly seen with fatty liver disease, whose global prevalence a 2023 systematic review estimated at 30 percent (Younossi 2023). The ACG guideline’s evaluation of hepatocellular injury includes testing for viral hepatitis A, B, and C, assessment for fatty liver disease and alcohol-related liver disease, screening for hereditary hemochromatosis, autoimmune hepatitis, Wilson disease, and alpha-1 antitrypsin deficiency, and a history of prescribed and over-the-counter medicines (Kwo 2017).
Kidney Dysfunction Pattern
- Elevated BUN and creatinine with a normal ratio
- Low eGFR
- Elevated potassium (kidneys cannot excrete it efficiently)
- Low CO2 / bicarbonate (metabolic acidosis from impaired acid excretion)
- Elevated phosphorus (if measured on a separate panel)
- Low calcium (impaired vitamin D activation in the kidneys)
The KDIGO 2024 guideline classifies chronic kidney disease by cause, GFR category, and albuminuria category, so the evaluation of a low eGFR includes a urine albumin-to-creatinine ratio and a repeat measurement to establish whether the change has lasted 3 months (KDIGO 2024).
Diet, Lifestyle and Supplement Research Related to CMP Markers
Practitioners of naturopathic and functional medicine often discuss diet, hydration, herbs, and supplements in connection with CMP results. What the research reports about some of them is summarized below. None of it replaces medical evaluation of an abnormal result, and decisions about medicines and supplements belong with a clinician.
Hydration
- Hydration status affects BUN, the BUN/creatinine ratio, sodium, albumin, and total protein, as described above.
- Alcohol and caffeine both have diuretic effects.
- Water-rich foods such as cucumbers, watermelon, celery, and broth add to fluid intake.
- Unrefined and pink salts are often described as sources of trace minerals. An analysis of 31 pink salt samples sold in Australia found that more than 30 g a day (about 6 teaspoons) would be needed to make any meaningful contribution to nutrient intake, a level that would provide excessive sodium; one sample contained lead above the national maximum contaminant level (Fayet-Moore 2020).
Liver-Related Herbs and Nutrients
- Milk thistle (Silybum marianum): A 2025 Cochrane review of 17 randomized trials (2,069 adults with MASLD) found that silymarin alone, compared with placebo or no intervention, may lower ALT (by about 7 U/L), but the evidence is very uncertain; silymarin complexes did not clearly change liver enzymes, and the review concluded that the benefits and harms of silymarin in MASLD are unclear (Wang 2025).
- Dandelion root (Taraxacum officinale) and burdock root (Arctium lappa): Used in traditional herbal medicine for the liver and bile flow; human trial evidence on their effect on CMP liver enzymes is limited.
- Turmeric / Curcumin: A 2025 meta-analysis of 15 randomized trials (905 people with NAFLD) found that curcumin lowered ALT (by about 4 U/L) and AST (by about 3 U/L) but not ALP; curcumin combined with piperine had no significant effect on ALT or AST (Vajdi 2025).
- N-Acetyl Cysteine (NAC): A precursor of glutathione, the liver’s main intracellular antioxidant.
- B vitamins: Vitamin B6 is a cofactor for ALT and AST, and B12 and folate take part in methylation pathways.
Blood Sugar
- Lifestyle: In the Diabetes Prevention Program, weight loss and physical activity reduced progression from elevated glucose to type 2 diabetes by 58 percent (Knowler 2002).
- Sleep: In 11 young men whose time in bed was restricted to 4 hours a night for 6 nights, glucose tolerance was lower than after a recovery period of 12 hours in bed a night (Spiegel 1999).
- Berberine: In a 3-month pilot trial, 36 adults with newly diagnosed type 2 diabetes were randomized to berberine or metformin, each 0.5 g three times a day; the glucose-lowering effect of berberine was similar to that of metformin. Across the pilot study, 20 patients (34.5 percent) had transient gastrointestinal adverse effects (Yin 2008).
- Chromium: A 2020 meta-analysis of randomized trials in type 2 diabetes reported reductions in fasting glucose, insulin, HbA1c (by about 0.7 percentage points), and HOMA-IR with chromium supplementation, with very high heterogeneity between trials (Asbaghi 2020). Chromium is also found in foods such as broccoli, green beans, and beef.
- Cinnamon: A meta-analysis of 10 randomized trials (543 patients with type 2 diabetes) found lower fasting plasma glucose (by about 25 mg/dL) with doses of 120 mg to 6 g a day, but no significant effect on HbA1c, and high heterogeneity that the authors said limits application to patient care (Allen 2013).
Kidney Markers
- High blood pressure and diabetes are leading causes of kidney damage.
- Dietary protein raises BUN, so a high-protein diet is one explanation considered for a persistently elevated BUN.
- The KDIGO 2024 guideline lists NSAIDs among medicines with nephrotoxic potential (KDIGO 2024).
- Astragalus (Astragalus membranaceus): A meta-analysis of 32 trials (2,462 patients with stage III diabetic nephropathy) reported lower urinary protein excretion, serum creatinine, BUN, and HbA1c when astragalus was added to standard RAAS-blocker drugs; the authors noted possible publication bias for some outcomes and called for rigorous, large, double-blind trials (Lin 2024).
Electrolytes
- Avocados, sweet potatoes, leafy greens, and bananas are dietary sources of potassium. In kidney disease, where potassium can rise, potassium intake is part of medical management.
- Magnesium deficiency can contribute to low potassium and low calcium, as described in the sections above.
- Aldosterone, a hormone of the adrenal glands, regulates sodium-potassium balance, so adrenal disorders can shift both.
Repeat Testing
How often a CMP is repeated is set by the ordering clinician and depends on the clinical context and the size of any abnormality. Several published definitions build repeat testing in:
- Diabetes: in the absence of unequivocal hyperglycemia, the ADA diagnosis requires two abnormal results, from the same sample or two separate samples (ADA 2026).
- Chronic kidney disease: the KDIGO definition requires a kidney abnormality to be present for at least 3 months, so a low eGFR is confirmed by repeat testing over time (KDIGO 2024).
- Markedly abnormal results (very high potassium, very low sodium, sharply rising creatinine) can call for urgent repeat testing and medical care.
- Monitoring: people with chronic kidney disease, diabetes, liver disease, or who take medicines that affect the kidneys or electrolytes are commonly tested at regular intervals.
Comparisons over time are most reliable when samples are drawn under similar conditions — the same fasting duration, a similar time of day, and the same laboratory — because reference ranges and methods differ between laboratories.
Related Tests
While the CMP provides a broad overview, it has limitations. The following tests are often ordered alongside it.
- Fasting Insulin: Used in research and some clinical practice to assess insulin resistance. When combined with fasting glucose, the HOMA-IR index can be calculated to quantify insulin resistance.
- Hemoglobin A1c (HbA1c): Reflects average blood sugar over the previous 2 to 3 months. The cutoffs commonly used for diagnosis are below 5.7 percent normal, 5.7 to 6.4 percent prediabetes, and 6.5 percent or higher diabetes (MedlinePlus).
- GGT (Gamma-Glutamyl Transferase): A sensitive marker of liver and bile-duct stress, particularly from alcohol and medications, and an enzyme of glutathione metabolism. Not included in the standard CMP.
- Phosphorus: Important for evaluating parathyroid function and kidney disease alongside calcium. Often run separately.
- Magnesium (serum and/or RBC): Only a small fraction of the body’s magnesium is in the blood, so serum magnesium is a limited guide to total body stores. RBC magnesium is used by some practitioners as a measure of intracellular status.
- Uric Acid: Elevated levels are associated with gout, metabolic syndrome, kidney stone risk, and cardiovascular disease.
- Urinalysis with urine albumin (albumin-to-creatinine ratio): Detects early kidney damage not yet reflected in serum creatinine or eGFR; KDIGO uses it, with eGFR, to classify CKD (KDIGO 2024).
- Complete Blood Count (CBC): Complements the CMP by providing information on red blood cells, white blood cells, and platelets.
- Lipid Panel: Total cholesterol, LDL, HDL, and triglycerides, sometimes with LDL particle number and size. Metabolic syndrome often presents with CMP abnormalities alongside dyslipidemia.
- Vitamin D (25-OH): Relevant to calcium interpretation. Health bodies differ on the cutoffs used to define deficiency and sufficiency.
- Liver Function Panel (direct and indirect bilirubin, LDH): When total bilirubin is elevated, fractionation helps distinguish between hepatocellular, hemolytic, and obstructive causes; the ACG guideline states that an elevated total bilirubin is fractionated into direct and indirect fractions (Kwo 2017).
- Cystatin C: An alternative marker for estimating GFR that is less influenced by muscle mass. The 2021 CKD-EPI equations include a combined creatinine–cystatin C version (Inker 2021).
A CMP is often paired with a CBC and a lipid panel in routine testing, with HbA1c, GGT, vitamin D, or fasting insulin added depending on the question being asked.
Key Research Papers
- Inker LA, Eneanya ND, Coresh J, et al. (2021). New Creatinine- and Cystatin C-Based Equations to Estimate GFR without Race. New England Journal of Medicine 385(19):1737-1749 — PubMed PMID: 34554658
- Delgado C, Baweja M, Crews DC, et al. (2022). A Unifying Approach for GFR Estimation: Recommendations of the NKF-ASN Task Force on Reassessing the Inclusion of Race in Diagnosing Kidney Disease. American Journal of Kidney Diseases 79(2):268-288.e1 — PubMed PMID: 34563581
- Kidney Disease: Improving Global Outcomes (KDIGO) CKD Work Group (2024). KDIGO 2024 Clinical Practice Guideline for the Evaluation and Management of Chronic Kidney Disease. Kidney International 105(4S):S117-S314 — PubMed PMID: 38490803
- American Diabetes Association Professional Practice Committee for Diabetes (2026). 2. Diagnosis and Classification of Diabetes: Standards of Care in Diabetes-2026. Diabetes Care 49(Supplement_1):S27-S49 — PubMed PMID: 41358893
- Kwo PY, Cohen SM, Lim JK (2017). ACG Clinical Guideline: Evaluation of Abnormal Liver Chemistries. American Journal of Gastroenterology 112(1):18-35 — PubMed PMID: 27995906
- Ozarda Y, Sikaris K, Streichert T, Macri J; IFCC Committee on Reference Intervals and Decision Limits (2018). Distinguishing reference intervals and clinical decision limits – A review by the IFCC Committee on Reference Intervals and Decision Limits. Critical Reviews in Clinical Laboratory Sciences 55(6):420-431 — PubMed PMID: 30047297
- Payne RB, Little AJ, Williams RB, Milner JR (1973). Interpretation of serum calcium in patients with abnormal serum proteins. British Medical Journal 4(5893):643-646 — PubMed PMID: 4758544
- Alhenc-Gelas M, Lefevre G, Bachmeyer C, et al. (2022). Poor performance of albumin or protein-adjusted plasma calcium to diagnose dyscalcemia in hospitalized patients: A confirmatory study in a general internal medicine department. La Revue de Médecine Interne 43(4):206-211 — PubMed PMID: 34953621
- Horsfall LJ, Rait G, Walters K, et al. (2011). Serum bilirubin and risk of respiratory disease and death. JAMA 305(7):691-697 — PubMed PMID: 21325185
- Schwertner HA, Vítek L (2008). Gilbert syndrome, UGT1A1*28 allele, and cardiovascular disease risk: possible protective effects and therapeutic applications of bilirubin. Atherosclerosis 198(1):1-11 — PubMed PMID: 18343383
- Younossi ZM, Golabi P, Paik JM, et al. (2023). The global epidemiology of nonalcoholic fatty liver disease (NAFLD) and nonalcoholic steatohepatitis (NASH): a systematic review. Hepatology 77(4):1335-1347 — PubMed PMID: 36626630
- Knowler WC, Barrett-Connor E, Fowler SE, et al. (2002). Reduction in the incidence of type 2 diabetes with lifestyle intervention or metformin. New England Journal of Medicine 346(6):393-403 — PubMed PMID: 11832527
- Spiegel K, Leproult R, Van Cauter E (1999). Impact of sleep debt on metabolic and endocrine function. Lancet 354(9188):1435-1439 — PubMed PMID: 10543671
- Yin J, Xing H, Ye J (2008). Efficacy of berberine in patients with type 2 diabetes mellitus. Metabolism 57(5):712-717 — PubMed PMID: 18442638
- Asbaghi O, Fatemeh N, Mahnaz RK, et al. (2020). Effects of chromium supplementation on glycemic control in patients with type 2 diabetes: a systematic review and meta-analysis of randomized controlled trials. Pharmacological Research 161:105098 — PubMed PMID: 32730903
- Allen RW, Schwartzman E, Baker WL, et al. (2013). Cinnamon use in type 2 diabetes: an updated systematic review and meta-analysis. Annals of Family Medicine 11(5):452-459 — PubMed PMID: 24019277
- Wang C, Shang Y, Kanaan G, et al. (2025). Silymarin for adults with metabolic dysfunction-associated steatotic liver disease. Cochrane Database of Systematic Reviews 6:CD015524 — PubMed PMID: 40552569
- Vajdi M, Hassanizadeh S, Hassanizadeh R, et al. (2025). Curcumin supplementation effect on liver enzymes in patients with nonalcoholic fatty liver disease: a GRADE-assessed systematic review and dose-response meta-analysis of randomized controlled trials. Nutrition Reviews 83(1):1-12 — PubMed PMID: 38213188
- Lin YQ, Yu F, Chen HJ, et al. (2024). Efficacy of astragalus combined with renin-angiotensin-aldosterone system blockers in the treatment of stage III diabetic nephropathy: a systematic review and meta-analysis. Renal Failure 46(2):2359033 — PubMed PMID: 38836372
- Fayet-Moore F, Wibisono C, Carr P, et al. (2020). An Analysis of the Mineral Composition of Pink Salt Available in Australia. Foods 9(10):1490 — PubMed PMID: 33086585
PubMed Topic Searches
- Comprehensive metabolic panel interpretation — PubMed literature search
- EGFR CKD-EPI equation — PubMed literature search
- BUN creatinine ratio — PubMed literature search
- ALT AST liver enzymes — PubMed literature search
- Hyperkalemia management — PubMed literature search
- Hyponatremia evaluation — PubMed literature search
- Anion gap metabolic acidosis — PubMed literature search
- Serum albumin prognosis — PubMed literature search
- Alkaline phosphatase elevation — PubMed literature search
- Fasting glucose prediabetes — PubMed literature search
External Authoritative Resources
- MedlinePlus — Comprehensive Metabolic Panel (CMP) (Medical Test)
- MedlinePlus Medical Encyclopedia — Comprehensive metabolic panel (normal values)
- MedlinePlus — Alkaline Phosphatase
- MedlinePlus — Total Protein and Albumin/Globulin (A/G) Ratio
- MedlinePlus Medical Encyclopedia — Calcium blood test
- MedlinePlus Medical Encyclopedia — Calcium, ionized
- MedlinePlus — Hemoglobin A1C (HbA1c) Test
- MedlinePlus Genetics — Gilbert syndrome
- MedlinePlus — Laboratory Tests Reference
- MedlinePlus — Medical Tests (U.S. National Library of Medicine)
- MedlinePlus — Medical Tests (U.S. National Library of Medicine)
Connections
Featured Videos