Agatston Score: How the Coronary Calcium Number Is Calculated
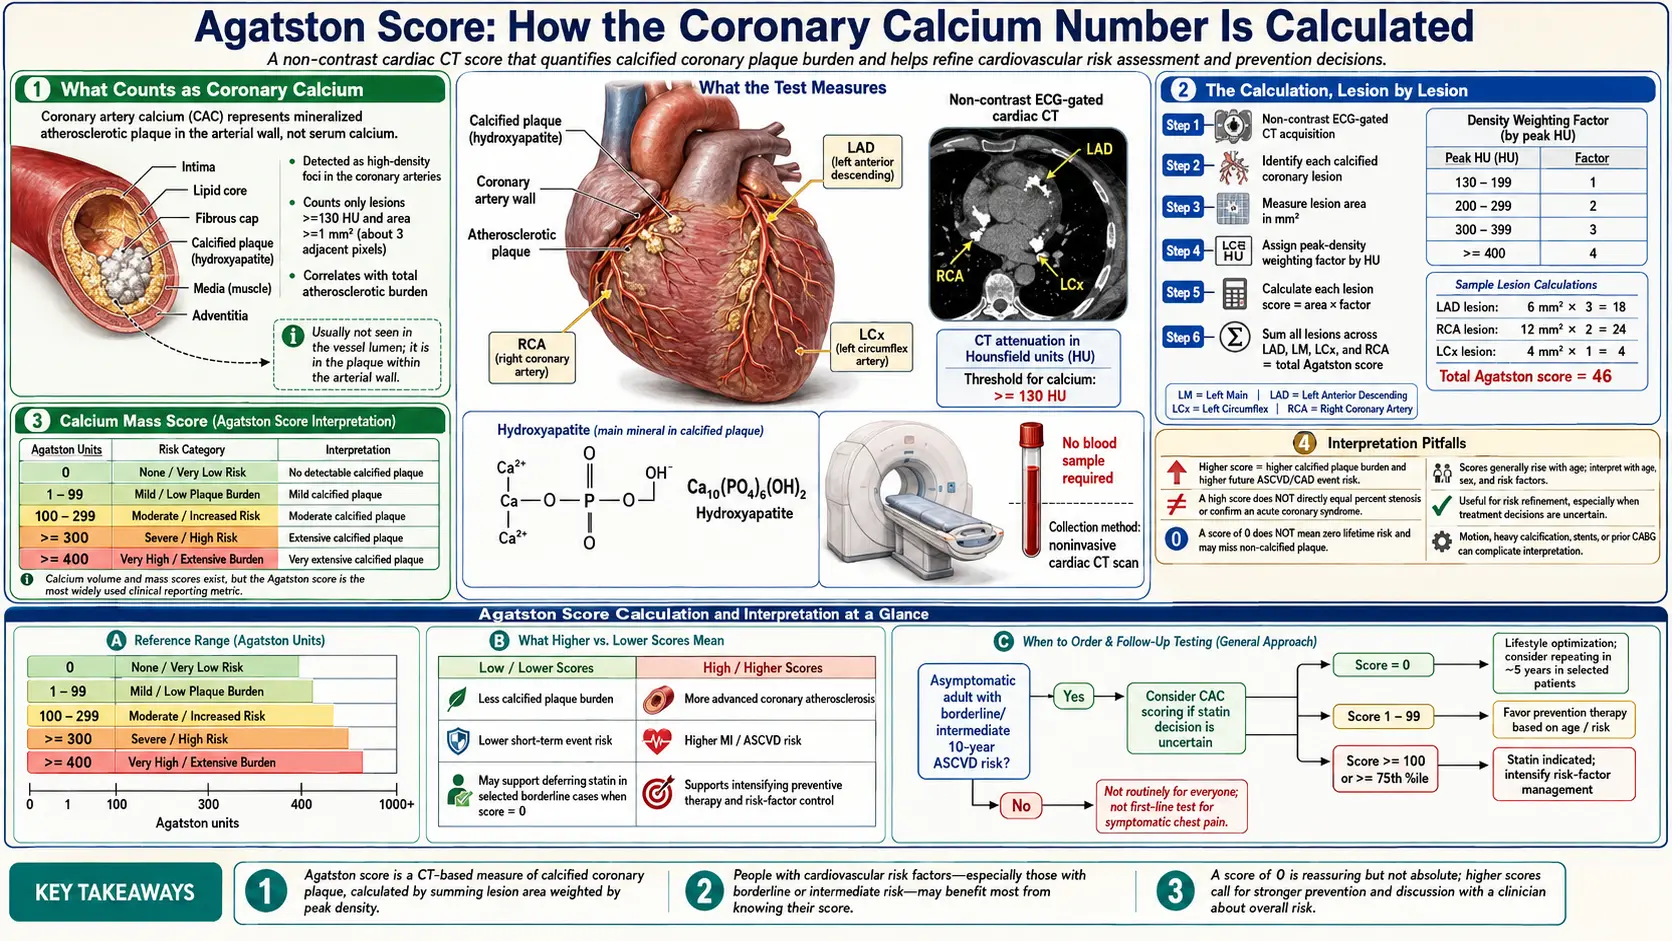
The Agatston score is the standard way coronary artery calcium is reported. It's named after Arthur Agatston, the Miami Beach, Florida cardiologist whose group described the method in 1990 (he later wrote The South Beach Diet). That 1990 paper scored 584 people with ultrafast (electron-beam) CT, using twenty contiguous 3 mm slices and calculating each total from the number, area and peak Hounsfield density of the calcified lesions found. The score combines two attributes of every calcified lesion in the coronary arteries — how big it is, and how dense it is — into a single weighted number, summed across all coronary territories. Understanding the math is useful because it explains why some scores rise even as plaque stabilizes, why volume scoring is sometimes preferred over Agatston, and why a single number conceals a lot of clinical detail.
Table of Contents
- What Counts as Coronary Calcium
- The 130 HU Threshold
- The Density Factor (1–4)
- The Calculation, Lesion by Lesion
- Total Score and Vessel Distribution
- Calcium Volume Score
- Calcium Mass Score
- Standard Interpretation Bands
- Vessel Distribution Matters
- Interpretation Pitfalls
- Key Research Papers
- Connections
- Featured Videos
What Counts as Coronary Calcium
Coronary calcium is calcified atherosclerotic plaque in the wall of the coronary arteries. Reviews of vascular calcification describe it as an active, regulated process in which smooth-muscle-derived cells take on bone-forming (osteoblast-like) traits and deposit hydroxyapatite, the same mineral as bone, within established plaque. In a 1995 autopsy study of 38 coronary arteries from 13 hearts, calcium area on electron-beam CT correlated closely with histological plaque area for each heart and each artery, but plaque area was roughly five times larger than calcium area, and minimal diffuse plaque could be present with no detectable calcium. Non-calcified (soft) plaque and very early atheroma are therefore not captured by the score.
The CT scan that generates the Agatston score is a non-contrast, EKG-gated chest CT. The scanner produces a stack of axial images through the heart; software identifies all voxels that exceed a defined density threshold within the anatomic territory of the four major coronary arteries: the Left Main (LM), the Left Anterior Descending (LAD), the Left Circumflex (LCX), and the Right Coronary Artery (RCA).
The 130 HU Threshold
CT density is measured in Hounsfield Units (HU), with water defined as 0 HU and air as -1000 HU. Bone and calcified plaque are highly attenuating. The Agatston method counts a region as calcified if its density is at least 130 HU and it exceeds a minimum lesion area (commonly given as 1 mm²; how many pixels that equals depends on the scanner).
The 130 HU threshold and the density weights were set for the electron-beam scanners of 1990. A 2017 review of CAC scoring methods described those early algorithms as simple and elegant but, to a large degree, arbitrary, because little evidence then existed on how best to build a score. The threshold has nonetheless been carried forward to modern multidetector scanners. A 2007 multi-institutional standard reported that a fixed calcium-hydroxyapatite density threshold (100 mg/cm³) reduced interscanner variability in Agatston and mass scores compared with the fixed 130 HU threshold.
The Density Factor (1–4)
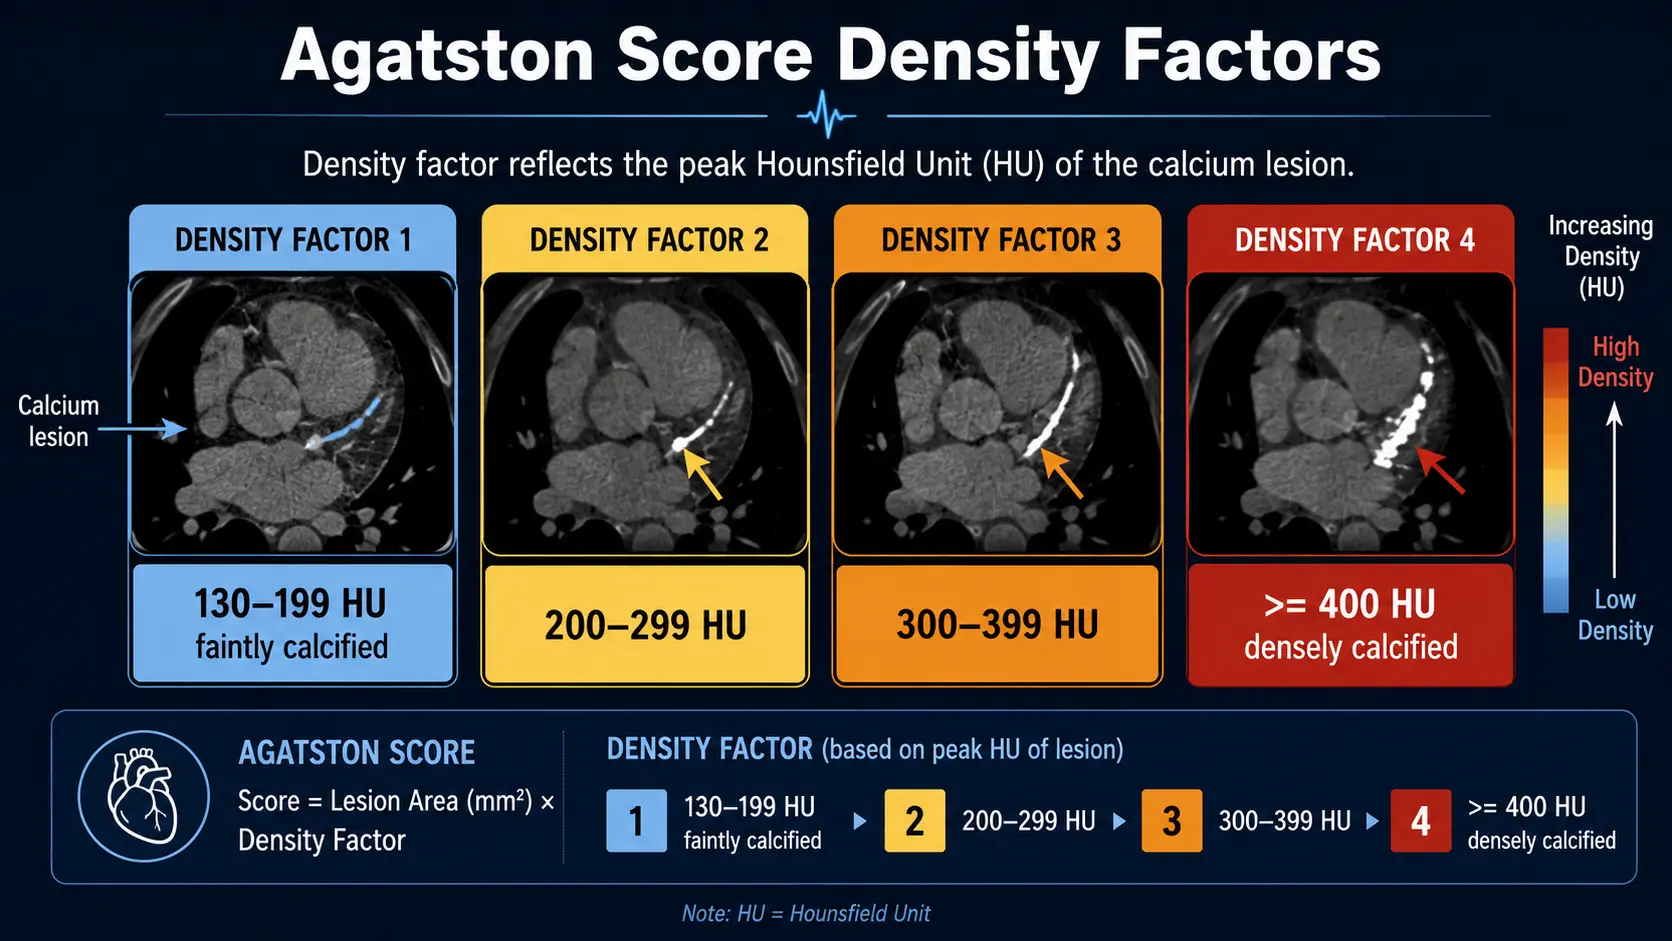
For each calcified lesion, the maximum Hounsfield Unit value within the lesion is recorded and converted to a density factor:
- 1 — peak density 130–199 HU (faintly calcified)
- 2 — peak density 200–299 HU
- 3 — peak density 300–399 HU
- 4 — peak density ≥400 HU (densely calcified)
This is the source of one of the more counterintuitive properties of the Agatston score: denser calcium gets a higher score. In MESA (3,398 participants with CAC above 0, median 7.6 years of follow-up), calcium volume was associated with higher coronary heart disease risk, while at any given volume higher calcium density was associated with lower risk (HR 0.73 per standard deviation for coronary heart disease events). A pooled analysis of 8 intravascular-ultrasound trials found that statins were associated with increased coronary calcification independent of their effect on plaque volume; the authors suggested this as one way statins may stabilize plaque. Because the Agatston method weights denser calcium upward, a rising score on serial scans does not by itself distinguish new plaque from denser existing calcium.
The Calculation, Lesion by Lesion
For each calcified lesion in each coronary artery:
Lesion score = Lesion area (mm²) × Density factor
For example, a 4 mm² lesion in the LAD with a peak density of 250 HU (density factor 2) contributes a lesion score of 4 × 2 = 8 to the total. A 10 mm² lesion at 450 HU (density factor 4) contributes 40.
The total Agatston score is simply the sum of lesion scores across all lesions in all coronary arteries. There is no upper bound. In the CAC Consortium, 2,869 of 66,636 asymptomatic adults had scores of 1,000 or more; most of them had calcium in all four coronary arteries.
Total Score and Vessel Distribution
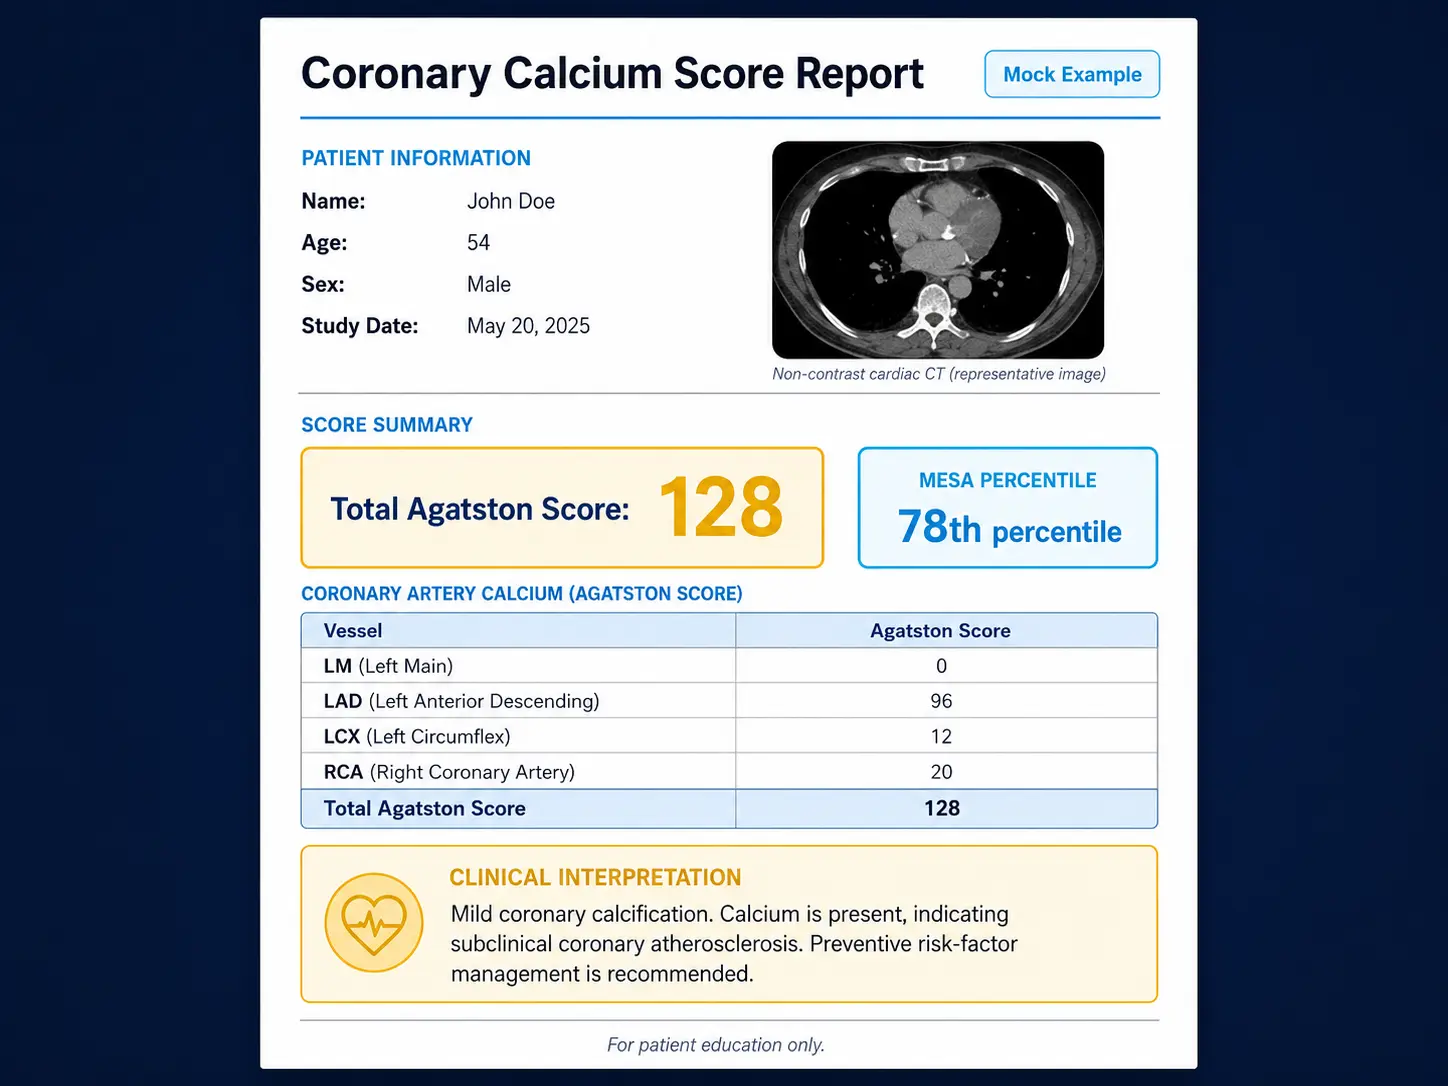
Radiology reports typically include:
- The total Agatston score
- Per-vessel scores: LM, LAD, LCX, RCA
- Number of lesions per vessel
- Age and sex percentile (using MESA data)
- Calcium volume score
- Sometimes a calcium mass score
The per-vessel breakdown matters more than the absolute score in some cases. Calcification in the Left Main coronary artery has different prognostic weight than the same volume of calcification in the LAD or RCA, because Left Main disease can compromise the supply to a much larger area of myocardium. In a cohort of 23,058 people referred for CAC scoring, Left Main calcium was associated with higher all-cause mortality after adjustment for the Agatston score.
Calcium Volume Score
The volume score is the total volume of calcified plaque in cubic millimeters, calculated by summing voxel volumes above the 130 HU threshold. Unlike the Agatston score, volume scoring does not weight by density. In a 1998 electron-beam CT study of repeat scans, the volumetric score was more reproducible than the traditional score (median change between paired scans 9% versus 15% for patient totals), and its variability was considerably smaller than the 44% median one-year increase seen in untreated patients. A 2007 multi-scanner standard found the opposite weakness across machines: volume scores had greater interscanner variance than Agatston or mass scores.
Some longitudinal studies report calcium volume rather than the Agatston score. Most clinical reports still use Agatston for interpretation against established percentile tables.
Calcium Mass Score
The mass score is calculated by summing voxel-by-voxel calcium hydroxyapatite mass, calibrated against a phantom of known density included in the scan. It measures the amount of calcium mineral directly but requires phantom calibration, which is not universal. In the 2007 international standard, the calcium mass score had the smallest variance as a function of patient size when a density segmentation threshold was used.
Standard Interpretation Bands
More than one category scheme is in use:
- Classic categories (set out in a 1999 Mayo Clinic review) — 0, no identifiable plaque; 1–10, minimal; 11–100, mild; 101–400, moderate; above 400, extensive.
- CAC-DRS (Society of Cardiovascular Computed Tomography, 2018) — CAC-DRS 0 (score 0), 1 (1–99), 2 (100–299) and 3 (300 or more), reported together with the number of coronary arteries involved.
- 1,000 or more — studied as a separate very-high-risk group: in the CAC Consortium (mean follow-up 12.3 years), this group had 5.04-fold cardiovascular mortality compared with a score of 0, and 1.71-fold compared with scores of 400–999, with no clear plateau in risk.
What the scores meant for events over 10 years in MESA (6,814 adults aged 45–84, free of cardiovascular disease at baseline): among people with a score of 0, atherosclerotic cardiovascular disease (ASCVD) event rates ranged from 1.3% to 5.6% across age, sex and race/ethnicity subgroups; with scores above 300 they ranged from 13.1% to 25.6%; and everyone with a score above 100 was estimated to have more than 7.5% risk. Each doubling of the score carried an estimated 14% relative increase in ASCVD risk, holding other risk factors constant.
The 2018 AHA/ACC cholesterol guideline uses the score for adults aged 40–75 at intermediate risk when a statin decision is uncertain: a score of 0 makes it reasonable to withhold statin therapy and reassess (except in smokers, people with diabetes, or a family history of premature ASCVD); 1–99 favors statin therapy, especially from age 55; and 100 or more, or the 75th percentile or higher, is the level at which the guideline states statin therapy is indicated.
These figures are population results. The MESA percentile (see MESA Calculator page) reframes the absolute number against age-and-sex norms, often providing a more clinically meaningful interpretation.
Vessel Distribution Matters
Two patients with identical Agatston scores can have very different prognoses depending on vessel distribution:
- Number of vessels — in 23,058 people referred for CAC scoring, compared with single-vessel calcium and after adjustment for the Agatston score, all-cause mortality was higher with 2-vessel (HR 1.61), 3-vessel (HR 1.99) and 4-vessel (HR 2.22) calcium
- Diffuse versus concentrated calcium — in the same cohort, calcium spread across vessels (“diffuse”) was associated with higher mortality in the 101–400 and above-400 score groups
- Left Main involvement — associated with increased mortality risk in that cohort, consistent with the size of the vascular bed it serves
- MESA — in 3,262 participants with CAC above 0 followed for a median of 10 years, adding the number of vessels with calcium to the Agatston score improved prediction of coronary and cardiovascular events
Interpretation Pitfalls
- Statin-associated calcification — statins have been associated with increased coronary calcification, so a rising score in someone taking a statin does not by itself show whether plaque is progressing
- Non-coronary calcium — mitral valve, aortic valve, aortic wall or pericardial calcium lies close to the coronary arteries and has to be excluded when lesions are assigned to vessels; in the CAC Consortium’s highest-scoring group, 46% also had aortic valve calcium and 21% mitral valve calcium
- Movement artifact — high heart rates or arrhythmia can blur images
- Stent or pacemaker artifact — metal hardware creates blooming artifact; CAC scoring is less useful in patients with prior stents or device leads
- Population norms — percentile tables come from the MESA cohort, which found that calcium levels differ by age, sex and race/ethnicity (higher in men, rising with age, with race differences that varied by age and sex)
- Four-bin density factor — the MESA density finding above (higher density, lower risk at the same volume) and regional-distribution studies have led researchers to ask whether accounting for density and distribution would improve the traditional score
Key Research Papers
- Agatston AS, Janowitz WR, Hildner FJ, Zusmer NR, Viamonte M Jr, Detrano R. (1990). Quantification of coronary artery calcium using ultrafast computed tomography. J Am Coll Cardiol 15(4):827–832 — PubMed PMID: 2407762
- Rumberger JA, Simons DB, Fitzpatrick LA, Sheedy PF, Schwartz RS. (1995). Coronary artery calcium area by electron-beam computed tomography and coronary atherosclerotic plaque area. A histopathologic correlative study. Circulation 92(8):2157–2162 — PubMed PMID: 7554196
- Callister TQ, Cooil B, Raya SP, Lippolis NJ, Russo DJ, Raggi P. (1998). Coronary artery disease: improved reproducibility of calcium scoring with an electron-beam CT volumetric method. Radiology 208(3):807–814 — PubMed PMID: 9722864
- Rumberger JA, Brundage BH, Rader DJ, Kondos G. (1999). Electron beam computed tomographic coronary calcium scanning: a review and guidelines for use in asymptomatic persons. Mayo Clin Proc 74(3):243–252 — PubMed PMID: 10089993
- McClelland RL, Chung H, Detrano R, Post W, Kronmal RA. (2006). Distribution of coronary artery calcium by race, gender, and age: results from the Multi-Ethnic Study of Atherosclerosis (MESA). Circulation 113(1):30–37 — PubMed PMID: 16365194
- McCollough CH, Ulzheimer S, Halliburton SS, Shanneik K, White RD, Kalender WA. (2007). Coronary artery calcium: a multi-institutional, multimanufacturer international standard for quantification at cardiac CT. Radiology 243(2):527–538 — PubMed PMID: 17456875
- Demer LL, Tintut Y. (2008). Vascular calcification: pathobiology of a multifaceted disease. Circulation 117(22):2938–2948 — PubMed PMID: 18519861
- Criqui MH, Denenberg JO, Ix JH, McClelland RL, Wassel CL, Rifkin DE, Carr JJ, Budoff MJ, Allison MA. (2014). Calcium density of coronary artery plaque and risk of incident cardiovascular events. JAMA 311(3):271–278 — PubMed PMID: 24247483
- Puri R, Nicholls SJ, Shao M, Kataoka Y, Uno K, Kapadia SR, Tuzcu EM, Nissen SE. (2015). Impact of statins on serial coronary calcification during atheroma progression and regression. J Am Coll Cardiol 65(13):1273–1282 — PubMed PMID: 25835438
- Tota-Maharaj R, Joshi PH, Budoff MJ, Whelton S, Zeb I, Rumberger J, Al-Mallah M, Blumenthal RS, Nasir K, Blaha MJ. (2015). Usefulness of regional distribution of coronary artery calcium to improve the prediction of all-cause mortality. Am J Cardiol 115(9):1229–1234 — PubMed PMID: 25743208
- Blaha MJ, Budoff MJ, Tota-Maharaj R, Dardari ZA, Wong ND, Kronmal RA, Eng J, Post WS, Blumenthal RS, Nasir K. (2016). Improving the CAC score by addition of regional measures of calcium distribution: Multi-Ethnic Study of Atherosclerosis. JACC Cardiovasc Imaging 9(12):1407–1416 — PubMed PMID: 27085449
- Blaha MJ, Mortensen MB, Kianoush S, Tota-Maharaj R, Cainzos-Achirica M. (2017). Coronary artery calcium scoring: is it time for a change in methodology? JACC Cardiovasc Imaging 10(8):923–937 — PubMed PMID: 28797416
- Budoff MJ, Young R, Burke G, et al. (2018). Ten-year association of coronary artery calcium with atherosclerotic cardiovascular disease (ASCVD) events: the Multi-Ethnic Study of Atherosclerosis (MESA). Eur Heart J 39(25):2401–2408 — PubMed PMID: 29688297
- Hecht HS, Blaha MJ, Kazerooni EA, Cury RC, Budoff M, Leipsic J, Shaw L. (2018). CAC-DRS: Coronary Artery Calcium Data and Reporting System. An expert consensus document of the Society of Cardiovascular Computed Tomography (SCCT). J Cardiovasc Comput Tomogr 12(3):185–191 — PubMed PMID: 29793848
- Grundy SM, Stone NJ, Bailey AL, et al. (2019). 2018 AHA/ACC/AACVPR/AAPA/ABC/ACPM/ADA/AGS/APhA/ASPC/NLA/PCNA Guideline on the Management of Blood Cholesterol. Circulation 139(25):e1082–e1143 — PubMed PMID: 30586774
- Peng AW, Mirbolouk M, Orimoloye OA, et al. (2020). Long-term all-cause and cause-specific mortality in asymptomatic patients with CAC ≥1,000: results from the CAC Consortium. JACC Cardiovasc Imaging 13(1 Pt 1):83–93 — PubMed PMID: 31005541
PubMed Topic Searches
- Original Agatston methodology — PubMed search
- Volume score vs Agatston score — PubMed search
- Density and statin stabilization — PubMed search
- Vessel-specific calcium prognosis — PubMed search
- 130 HU threshold — PubMed search
External Authoritative Resources
Connections
- All Lab Tests
- Coronary Calcium Score
- MESA Risk Calculator and Age Percentiles
- CAC Zero and the Power of Negative Result
- CAC vs Other Cardiac Tests
- Statin Threshold and CAC
- Soft Plaque and CAC Limitations
- Insurance Cost and Access
- CAC in Women and Younger Adults
- Reversal Plaque Stabilization and Lifestyle
- Lipoprotein(a)
- ApoB
- Lipid Panel
- Calcium
- Atherosclerosis
- Cardiovascular Disease
- Full Body MRI