MESA Risk Calculator and CAC Age Percentiles: Reframing the Score
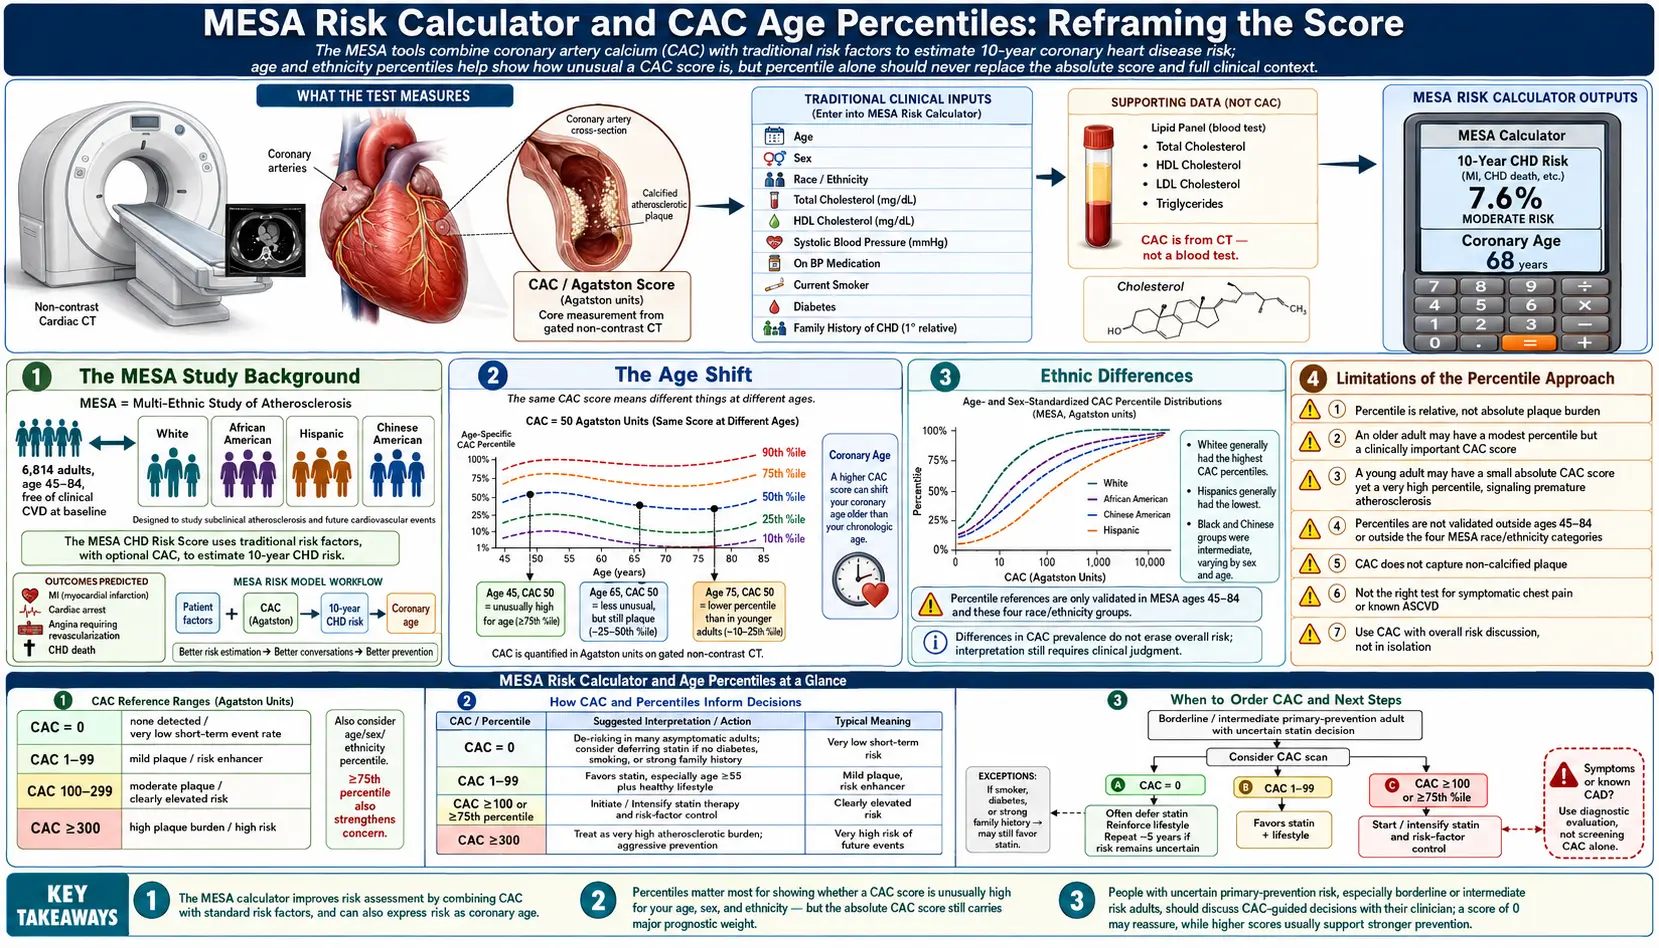
An Agatston score carries a different meaning at different ages, because coronary artery calcium (CAC) becomes more common and more extensive with age (McClelland 2006). The Multi-Ethnic Study of Atherosclerosis (MESA) produced two free online tools from its cohort: a reference calculator that places a score as a percentile among people of the same age, sex and race/ethnicity, and a 10-year coronary heart disease (CHD) risk score that combines the calcium score with traditional risk factors. This page sets out what the published MESA papers and the ACC/AHA guidelines report about both.
Table of Contents
- The MESA Study Background
- What a CAC Percentile Means
- MESA Calculator Inputs
- The Age Shift
- Sex Differences in CAC Distribution
- Ethnic Differences
- MESA 10-Year Risk Score
- What the Guidelines and Outcome Studies Report
- Limitations of the Percentile Approach
- Key Research Papers
- Connections
- Featured Videos
The MESA Study Background
The Multi-Ethnic Study of Atherosclerosis (MESA) is a prospective cohort study, initiated in July 2000, of 6,814 men and women aged 45–84 who identified themselves as white, African American, Hispanic or Chinese American and had no clinically apparent cardiovascular disease. Participants were recruited from six US communities in 2000–2002 (Bild 2002; McClelland 2015). The baseline examination included a CT measurement of coronary calcium alongside cardiac MRI, carotid ultrasound, ankle and brachial blood pressures and standard risk-factor measurements; selected measures were repeated to study progression, and participants were followed for cardiovascular events (Bild 2002).
The MESA dataset is the basis of two tools: the MESA Calcium Score Reference Calculator, which returns an estimated percentile for a CAC score given age, sex and race/ethnicity (McClelland 2006), and the MESA 10-Year CHD Risk Score, which combines the CAC score with traditional risk factors to estimate 10-year CHD risk (McClelland 2015). Both are available online at mesa-nhlbi.org.
What a CAC Percentile Means
A CAC percentile states where a score falls within the MESA reference distribution for people of the same age, sex and race/ethnicity: a result at the 90th percentile is higher than the scores of 90% of that matched group. The reference percentiles were estimated in 6,110 MESA participants (53% female, average age 62) after people with treated diabetes were excluded, so they describe people free of clinical cardiovascular disease and treated diabetes (McClelland 2006). The authors describe the purpose as examining “whether a patient has a high CAC score relative to others with the same age, gender, and race/ethnicity.”
In that analysis, calcium amount and prevalence were steadily higher with increasing age (McClelland 2006), so the same absolute score sits at a lower percentile in an older person than in a younger one. The 2018 AHA/ACC cholesterol guideline uses both scales, naming a CAC score of ≥100 Agatston units or ≥75th percentile as a statin threshold (see What the Guidelines and Outcome Studies Report, below).
MESA Calculator Inputs
The MESA percentile calculator takes:
- Age (45–84, the age range of the MESA cohort)
- Sex (male / female)
- Race/ethnicity (white, Black/African American, Hispanic, Chinese American)
- The Agatston score
It returns the estimated percentile for that score among MESA participants of the same age, sex and race/ethnicity (McClelland 2006).
The Age Shift
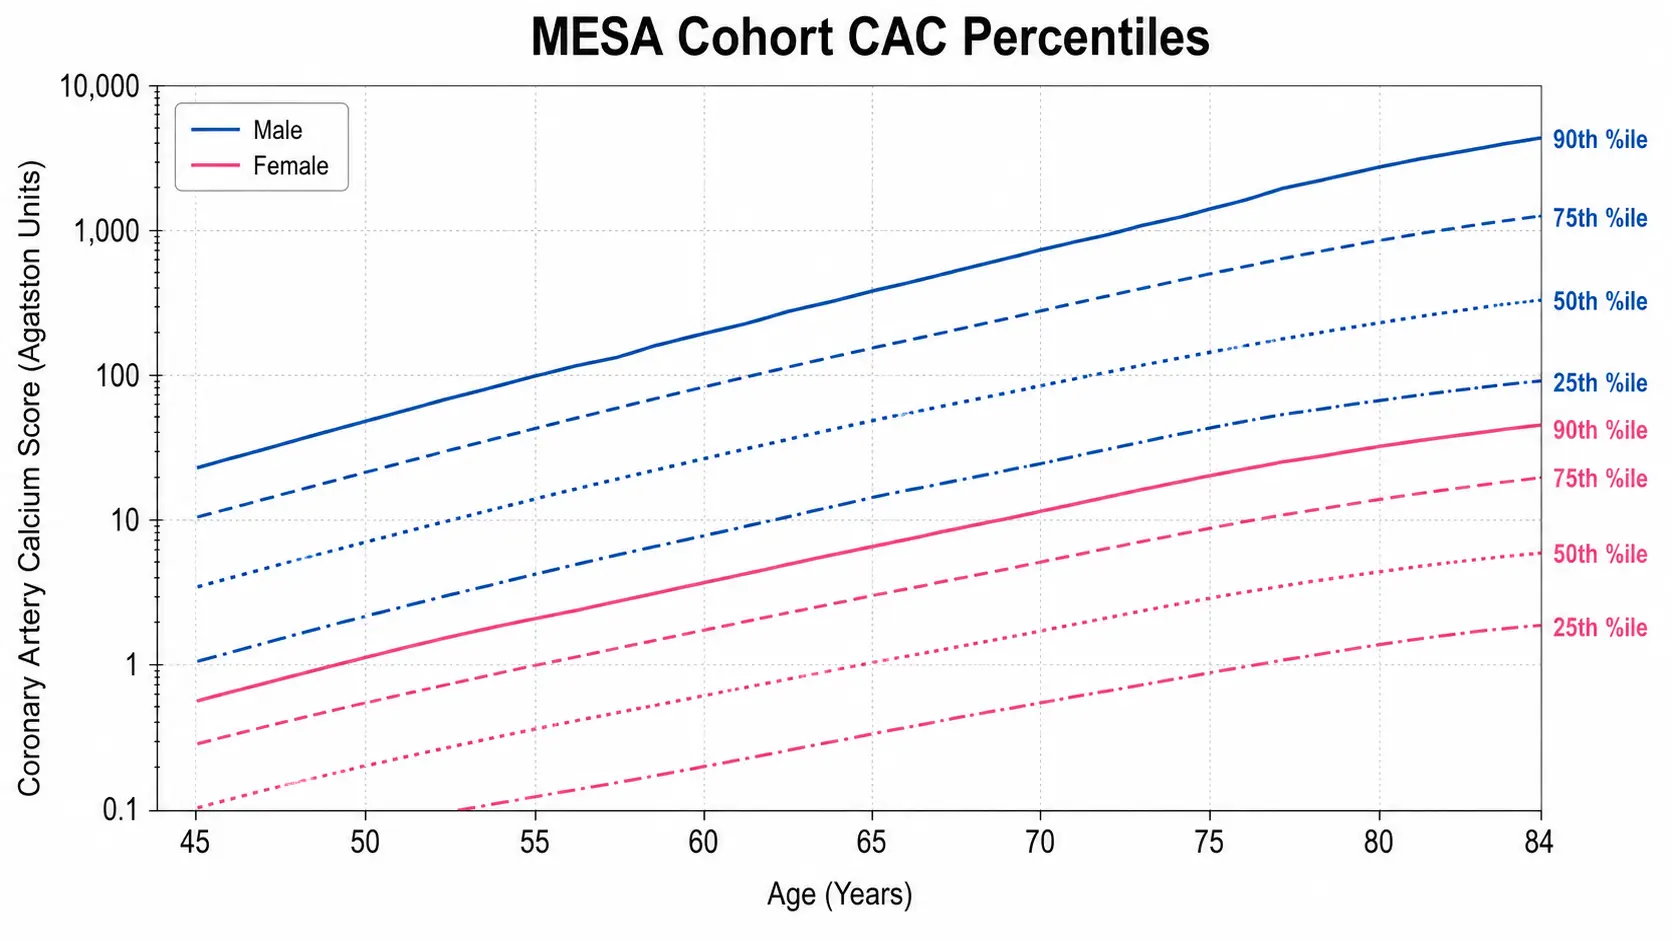
MESA’s reference percentiles rise steadily with age in both men and women (McClelland 2006), so one absolute score corresponds to a progressively lower percentile across the 45-to-84 age range. The percentile for a particular age, sex, race/ethnicity and score comes from the MESA reference calculator; the published abstracts checked for this page do not list those values, and this page does not reproduce them.
Age changes where a score falls in the distribution, but in MESA it did not change how strongly the score tracked future events: the association between CAC and 10-year atherosclerotic cardiovascular disease (ASCVD) events was not significantly modified by age, sex, race/ethnicity or baseline lipid-lowering use (Budoff 2018).
Sex Differences in CAC Distribution
In MESA, men had greater calcium levels than women (McClelland 2006), so a given absolute score falls at a higher percentile for a woman than for a man of the same age and race/ethnicity. The prevalence of any coronary calcium (Agatston score >0) at the MESA baseline examination was (Bild 2005):
- Men — 70.4% of white, 52.1% of Black, 56.5% of Hispanic and 59.2% of Chinese American participants
- Women — 44.6% of white, 36.5% of Black, 34.9% of Hispanic and 41.9% of Chinese American participants
Median scores and percentile cut-offs by age and sex are not stated in the abstracts checked for this page and are not reproduced here; the MESA calculator returns them. CAC testing in women is covered on the Women & Younger Adults page.
Ethnic Differences
MESA found ethnic differences in the presence and quantity of coronary calcification that were not explained by coronary risk factors (Bild 2005). After adjustment for age, education, lipids, body mass index, smoking, diabetes, hypertension, treatment for high cholesterol, sex and scanning centre, and in the percentile tables (McClelland 2006):
- White Americans — the reference group. White men consistently had the highest percentiles, and white women had the highest percentiles among women.
- Black/African Americans — relative risk of having any coronary calcification 0.78 (95% CI 0.74–0.82) compared with whites; among those with calcium, the amount was 69% that of whites (Bild 2005). Black men had the lowest percentiles at the younger ages.
- Hispanic Americans — relative risk 0.85 (0.79–0.91); amount 74% that of whites (Bild 2005). Hispanic women generally had the lowest percentiles among women, while Hispanic men had the second-highest percentiles among men.
- Chinese Americans — relative risk 0.92 (0.85–0.99); amount 77% that of whites (Bild 2005). Chinese men had the lowest percentiles at the older ages, and Chinese women the lowest values in the oldest age group.
Whether a lower calcium burden makes the score less predictive was examined directly in MESA. Among 6,722 participants followed for a median of 3.8 years, a doubling of the calcium score increased the risk of a major coronary event by 15–35% across the four groups, and the authors reported “no major differences among racial and ethnic groups in the predictive value of calcium scores” (Detrano 2008). Over 10 years of follow-up, the association between CAC and ASCVD events was likewise not significantly modified by race/ethnicity (Budoff 2018).
MESA 10-Year Risk Score
The MESA 10-Year CHD Risk Score was derived in 6,726 MESA participants followed for a median of 10.2 years and validated externally in two other cohorts (McClelland 2015). Its inputs are:
- Age, sex and race/ethnicity
- Diabetes and current smoking
- Total cholesterol, HDL cholesterol and lipid-lowering medication
- Systolic blood pressure and antihypertensive medication
- Family history of heart attack in a parent, sibling or child at any age (MESA did not record the relative’s age at baseline, so premature family history could not be used)
- The CAC score
Body mass index and diastolic blood pressure were considered but not retained. The outcome is hard CHD events: myocardial infarction, resuscitated cardiac arrest, fatal CHD, and revascularization only when the participant also had prior or concurrent adjudicated angina; 422 such events occurred. Stroke is not part of this outcome (McClelland 2015).
Adding CAC raised the C-statistic from 0.75 to 0.80 (p < 0.0001) compared with the same MESA model built without CAC. In external validation, Harrell’s C-statistic was 0.779 in the Heinz Nixdorf Recall Study (Germany) and 0.816 in the Dallas Heart Study, and average predicted 10-year risk was within one-half of a percent of the observed event rate in both (McClelland 2015). The authors chose not to compare the score with existing risk scores, writing that those scores “have been shown to be poorly calibrated and/or have low discrimination in MESA” and that such a comparison “would likely overstate the added value due to inclusion of CAC.” They state that the updated risk estimate “could be used to help make therapeutic decisions, such as the decision to start statin or aspirin therapy in primary prevention.”
What the Guidelines and Outcome Studies Report
The 2018 AHA/ACC cholesterol guideline’s take-home messages address adults 40 to 75 years of age without diabetes, with LDL-C of 70 to 189 mg/dL and a 10-year ASCVD risk of 7.5% to 19.9%: “if a decision about statin therapy is uncertain, consider measuring CAC” (Grundy 2019). The guideline then states:
- CAC zero — “treatment with statin therapy may be withheld or delayed, except in cigarette smokers, those with diabetes mellitus, and those with a strong family history of premature ASCVD.”
- CAC 1 to 99 — “favors statin therapy, especially in those ≥55 years of age.”
- CAC ≥100 Agatston units or ≥75th percentile — “For any patient … statin therapy is indicated unless otherwise deferred by the outcome of clinician–patient risk discussion.”
The 2019 ACC/AHA primary-prevention guideline states that in adults at intermediate risk (≥7.5% to <20% 10-year ASCVD risk) or selected adults at borderline risk (5% to <7.5%), “if risk-based decisions for preventive interventions (eg, statin therapy) remain uncertain, it is reasonable to measure a coronary artery calcium score to guide clinician–patient risk discussion” (Class IIa) (Arnett 2019).
Outcome studies behind these thresholds report:
- CAC of 0, long term — among 9,715 people followed for a mean of 14.6 years, the 4,864 with a baseline score of 0 had a “warranty period” (pre-defined as an annual all-cause mortality rate below 1%) of almost 15 years at low and intermediate risk, with no significant differences by age or sex (Valenti 2015).
- 10-year ASCVD events in MESA — among 6,814 participants followed for a median of 11.1 years, 10-year event rates ranged from 1.3% to 5.6% with CAC = 0 and from 13.1% to 25.6% with CAC >300 across age, sex and racial subgroups; everyone with CAC >100 was estimated to have >7.5% 10-year risk regardless of demographic subset. The authors describe CAC = 0 and CAC ≥100 as “potentially valuable cutpoints for the consideration of preventive therapies” (Budoff 2018).
- Coronary events by score band — compared with no coronary calcium, the adjusted risk of a coronary event was 7.73 times higher with scores of 101–300 and 9.67 times higher with scores above 300 (Detrano 2008).
Limitations of the Percentile Approach
- MESA enrolled people aged 45–84, and the 2015 authors state that the risk algorithm is limited to this range (McClelland 2015); the percentile references likewise come from that age range
- MESA includes four race/ethnic groups; “there are many race/ethnicities not represented in the study, and the utility of the algorithm in these groups is unknown” (McClelland 2015)
- The percentile reference population excluded people with clinical cardiovascular disease and treated diabetes (McClelland 2006)
- The 2018 guideline states its statin threshold as ≥100 Agatston units or ≥75th percentile, so either scale can meet it on its own (Grundy 2019)
- The MESA risk score predicts hard CHD events, not stroke; the 10-year MESA analysis that included stroke is Budoff 2018
The percentile and absolute-score thresholds are cut-points on continuous scales: in MESA, 10-year ASCVD event rates increased steadily across CAC categories, with a 14% relative increase in ASCVD risk for each doubling of CAC when other risk factors were held constant (Budoff 2018).
Key Research Papers
- McClelland RL, Chung H, Detrano R, Post W, Kronmal RA (2006). Distribution of coronary artery calcium by race, gender, and age: results from the Multi-Ethnic Study of Atherosclerosis (MESA). Circulation 113(1):30–37 — PubMed PMID: 16365194
- McClelland RL, Jorgensen NW, Budoff M, et al. (2015). 10-Year Coronary Heart Disease Risk Prediction Using Coronary Artery Calcium and Traditional Risk Factors: Derivation in the MESA (Multi-Ethnic Study of Atherosclerosis) With Validation in the HNR (Heinz Nixdorf Recall) Study and the DHS (Dallas Heart Study). J Am Coll Cardiol 66(15):1643–1653 — PubMed PMID: 26449133
- Bild DE, Bluemke DA, Burke GL, et al. (2002). Multi-Ethnic Study of Atherosclerosis: objectives and design. Am J Epidemiol 156(9):871–881 — PubMed PMID: 12397006
- Bild DE, Detrano R, Peterson D, et al. (2005). Ethnic differences in coronary calcification: the Multi-Ethnic Study of Atherosclerosis (MESA). Circulation 111(10):1313–1320 — PubMed PMID: 15769774
- Detrano R, Guerci AD, Carr JJ, et al. (2008). Coronary calcium as a predictor of coronary events in four racial or ethnic groups. N Engl J Med 358(13):1336–1345 — PubMed PMID: 18367736
- Budoff MJ, Young R, Burke G, et al. (2018). Ten-year association of coronary artery calcium with atherosclerotic cardiovascular disease (ASCVD) events: the multi-ethnic study of atherosclerosis (MESA). Eur Heart J 39(25):2401–2408 — PubMed PMID: 29688297
- Valenti V, Ó Hartaigh B, Heo R, et al. (2015). A 15-Year Warranty Period for Asymptomatic Individuals Without Coronary Artery Calcium: A Prospective Follow-Up of 9,715 Individuals. JACC Cardiovasc Imaging 8(8):900–909 — PubMed PMID: 26189116
- Grundy SM, Stone NJ, Bailey AL, et al. (2019). 2018 AHA/ACC/AACVPR/AAPA/ABC/ACPM/ADA/AGS/APhA/ASPC/NLA/PCNA Guideline on the Management of Blood Cholesterol: A Report of the American College of Cardiology/American Heart Association Task Force on Clinical Practice Guidelines. Circulation — PubMed PMID: 30586774
- Arnett DK, Blumenthal RS, Albert MA, et al. (2019). 2019 ACC/AHA Guideline on the Primary Prevention of Cardiovascular Disease: A Report of the American College of Cardiology/American Heart Association Task Force on Clinical Practice Guidelines. Circulation — PubMed PMID: 30879355
PubMed Topic Searches
- MESA CAC percentile reference — PubMed search
- MESA 10-year risk score — PubMed search
- Ethnic differences in CAC — PubMed search
- Sex differences in CAC — PubMed search
- ASCVD vs MESA risk calculators — PubMed search
External Authoritative Resources
Connections
- All Lab Tests
- Coronary Calcium Score
- CAC in Women and Younger Adults
- Agatston Score Calculation and Interpretation
- ApoB
- Soft Plaque and CAC Limitations
- Reversal Plaque Stabilization and Lifestyle
- CAC Zero and the Power of Negative Result
- Insurance Cost and Access
- Statin Threshold and CAC
- CAC vs Other Cardiac Tests
- Lipoprotein(a)
- Lipid Panel
- Calcium
- Atherosclerosis
- Hypertension
- Diabetes
- Full Body MRI