⚠ Evidence warning: Clinical trials or other evidence do not support the claims that the in-vitro starch digestion rate of oat products almost perfectly predicts their glycemic response, that a 0.42% hemoglobin A1c drop is on the same order as a low-dose oral glycemic agent, that oats reduce fasting insulin and glucose after a glucose tolerance test, that instant or extruded oats show smaller or null effects in trials, that oat benefits in type 2 diabetes extend to insulin sensitivity over weeks, and that whole-grain interventions show consistent improvement with whole-form oats and no clear benefit from highly processed oats. This page keeps it as a report of what people, websites or other media say.
Oats for Glycemic Response
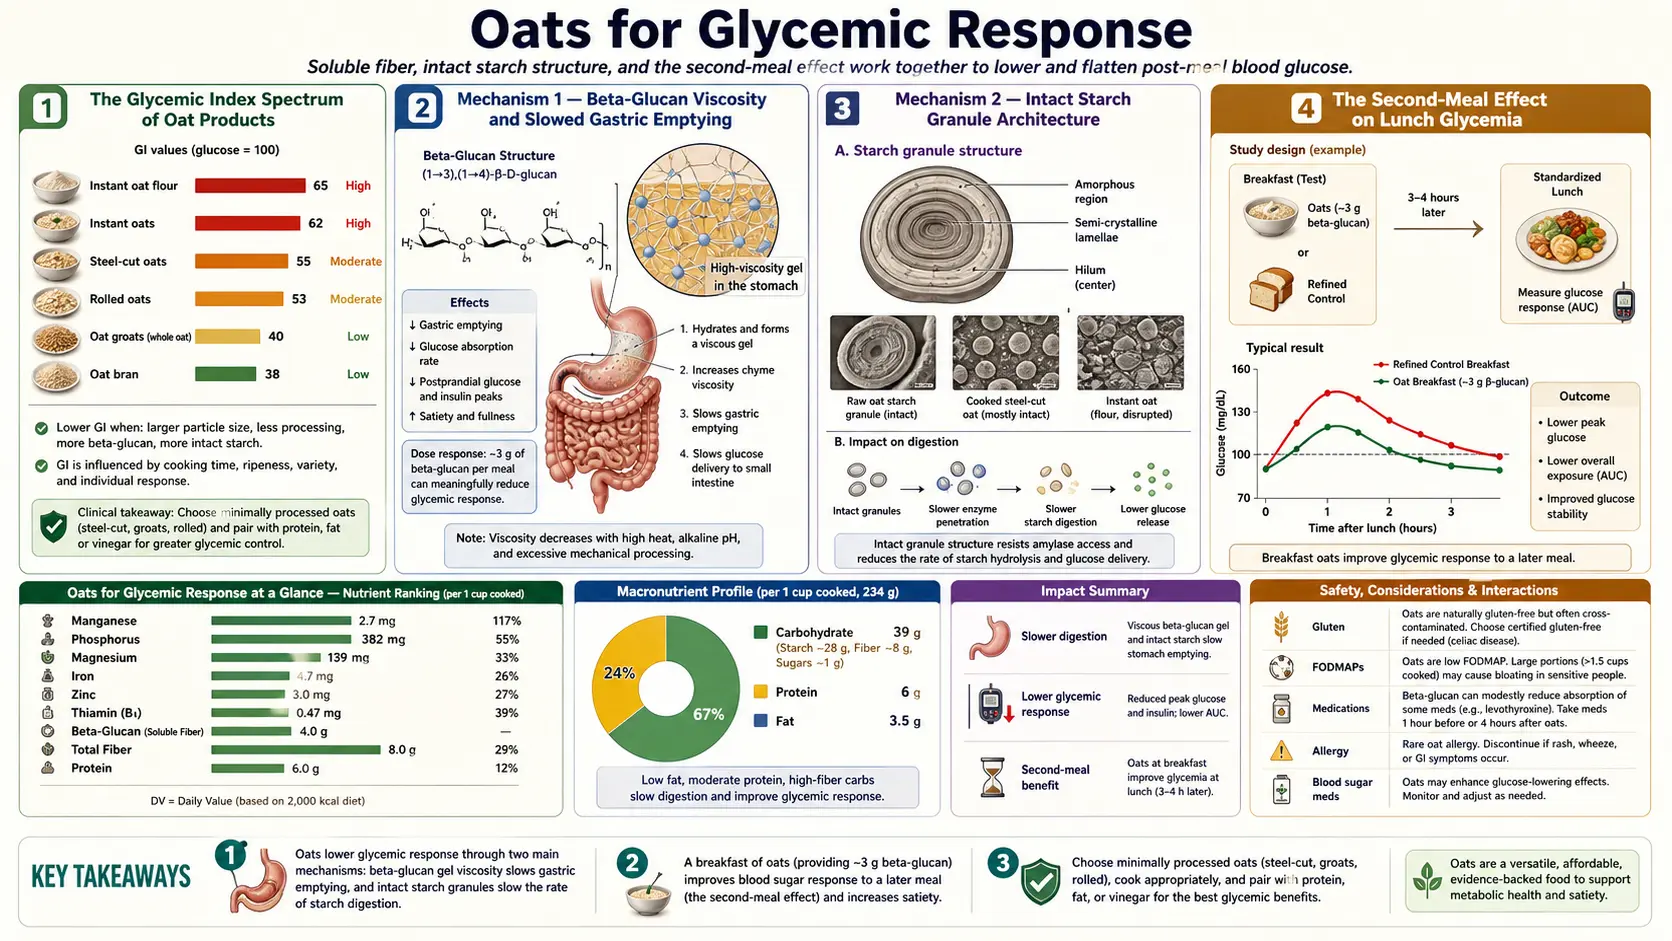
The glycemic index of oats spans a remarkably wide range — from approximately 55 for steel-cut oats (a "low" classification, comparable to lentils) to approximately 83 for instant single-serve packets (a "high" classification, on par with white bread and worse than table sugar). This 28-point swing across what consumers think of as "oats" is the single most important practical fact in oat nutrition. The mechanism is twofold: viscosity from beta-glucan slows gastric emptying and reduces the rate at which glucose is delivered to the small-intestinal brush border, and intact starch granules (preserved by minimal mechanical disruption) resist alpha-amylase digestion. Both mechanisms collapse when oats are pre-cooked, finely milled, and dried into instant form. Beyond the immediate postprandial response, oats produce a "second-meal effect" — colonic fermentation byproducts (short-chain fatty acids) reaching the liver via the portal vein hours after breakfast continue to suppress hepatic glucose output and improve lunch-time glycemia. This page maps the GI spectrum, the trial evidence in type 2 diabetes, the insulin response separate from the glucose response, and the practical kitchen choices that determine whether oats are an asset or a liability for glycemic control.
Table of Contents
- The Glycemic Index Spectrum of Oat Products
- Mechanism 1 — Beta-Glucan Viscosity and Slowed Gastric Emptying
- Mechanism 2 — Intact Starch Granule Architecture
- The Second-Meal Effect on Lunch Glycemia
- Trial Evidence in Type 2 Diabetes and Raised Blood Pressure (Hou 2015, Tappy 1996, Maki 2007)
- Insulin Response Distinct from Glucose Response
- The Oat Milk Paradox — Why "Oats" in Liquid Form Are High GI
- What Continuous Glucose Monitor Users Report
- Combining With Protein and Fat to Flatten the Curve Further
- Cautions
- Key Research Papers
- Connections
- Featured Videos
The Glycemic Index Spectrum of Oat Products
The glycemic index (GI) ranks foods by how much they raise blood glucose over 2 hours after consumption, relative to a 50 g pure-glucose reference (which is set at 100). Foods are classified as low (≤ 55), medium (56–69), or high (≥ 70). The international GI tables compiled by Atkinson, Foster-Powell, and Brand-Miller (Diabetes Care 2008) and updated periodically since contain dozens of oat-product entries spanning the entire range:
- Whole oat groats (intact kernels), boiled: GI ≈ 45 — the lowest of any oat form, comparable to legumes
- Steel-cut oats (groats cut into 2–3 pieces), boiled: GI ≈ 53–55 — firmly in the low category
- Old-fashioned rolled oats, boiled: GI ≈ 55–58 — borderline low/medium
- Quick-cooking rolled oats: GI ≈ 65–72 — medium to low-high
- Instant single-serve oatmeal packet, prepared with hot water: GI ≈ 79–83 — high, on par with white bread (GI 75) or jasmine rice (GI 80) and worse than table sugar (sucrose GI 65)
- Oat-flour cookies/baked goods: GI typically 70–80 — high, with the exact value depending on added fat and protein
- Oat-based ready-to-eat cereals (toasted oat rings, oat-bran flakes): GI ≈ 70–82 — high, due to extrusion and small particle size
- Oat milk (commercial): GI typically 60–78 — medium to high depending on whether enzymatic hydrolysis is used (most commercial oat milks now use alpha-amylase treatment that liberates free maltose, raising sweetness and GI)
The 38-point range from oat groats (GI 45) to instant oatmeal (GI 83) within a single grain category is unusual — most foods cluster within a 15–20 point window across processing variations. The reason is that oats start with a structure that is exceptionally good at slowing glucose absorption, and that structure is exceptionally easy to destroy through processing.
Pooled trial data support this processing pattern. A 2021 meta-analysis of randomized trials comparing oats with refined grains (Musa-Veloso and colleagues, ten publications) found that intact oat kernels and thick oat flakes (thicker than 0.6 mm) both lowered the after-meal blood-sugar and insulin responses, while thin, quick and instant flakes (0.6 mm or thinner) showed no effect on either.
Mechanism 1 — Beta-Glucan Viscosity and Slowed Gastric Emptying
The same beta-glucan polymer responsible for the cholesterol-lowering effect (covered in the Beta-Glucan and Cholesterol deep-dive) is the primary driver of the glycemic-lowering effect. In the stomach, beta-glucan hydrates and forms a viscous gel that physically delays gastric emptying. Postprandial gastric scintigraphy studies show 30–90 minute extensions of half-emptying time with beta-glucan-rich oat meals compared with isocaloric refined-carbohydrate controls.
In the small intestine, the viscous chyme creates an unstirred boundary layer at the brush border that slows glucose diffusion to the SGLT1 (sodium-glucose linked transporter) and GLUT2 transporters on enterocytes. The result is a slower delivery of absorbed glucose to the portal blood and a flatter postprandial glucose excursion.
The effect depends on viscosity, not only on the mass of beta-glucan eaten. Wolever's 2010 trial (Am J Clin Nutr 92:723) showed this for cholesterol: in 345 adults who completed it, 3 g a day of high-molecular-weight beta-glucan lowered low-density lipoprotein (LDL) cholesterol by 0.21 mmol/L (5.5%), while 4 g a day of low-molecular-weight beta-glucan (210,000 g/mol) gave a non-significant 0.10 mmol/L; the authors put the loss of effect at 50% when molecular weight was reduced that far. The Regand et al. 2009 trial (J Agric Food Chem 57:8831) looked at blood sugar directly. It tested four oat foods — crisp bread, granola, porridge and pasta — each with 4 g of beta-glucan, against low-beta-glucan control products. Porridge and granola blunted the peak blood-glucose rise most, because their beta-glucan kept a high molecular weight and viscosity; breakdown of the beta-glucan in bread and pasta reduced its effect. Combined with earlier data, 73% of beta-glucan's effect on the glucose peak was explained by its molecular weight times its concentration.
A 2021 meta-analysis (Zurbau and colleagues) pooled 103 trial comparisons in 538 people. Adding oat beta-glucan to a carbohydrate meal cut the blood-sugar rise (area under the curve) by 23%, the peak by 28% and the insulin rise by 22%. The effect grew with dose. It appeared only when the beta-glucan's molecular weight was above 300 kg/mol, and the results were similar in people with and without diabetes.
Oat bran taken in water before a meal also lowered the rise. In a 2016 pilot study of 10 healthy people, oat bran rich in high-molecular-weight beta-glucan was mixed in water and taken before a white-bread meal; each gram of beta-glucan lowered the glucose area by about 4.35% and the peak rise by about 6.57%.
This is why instant oatmeal, despite containing the labeled amount of beta-glucan, produces nearly the glycemic excursion of pure starch — the beta-glucan molecular weight has been degraded to the point that viscosity no longer slows the gastric and intestinal kinetics.
Mechanism 2 — Intact Starch Granule Architecture
The second mechanism is independent of beta-glucan: the physical architecture of starch granules. In intact whole-grain oats, starch is stored inside the endosperm cells in semi-crystalline granules that are partially protected from alpha-amylase by the surrounding cell wall and protein matrix. Steel-cut oats preserve the largest fraction of intact endosperm cells. Rolling and milling progressively disrupts the cell walls, exposing starch granules to amylase. Pre-cooking (the process that creates "instant" oats) gelatinizes the starch — converting it from a crystalline to an amorphous structure that is highly susceptible to enzymatic digestion.
Granfeldt, Eliasson and Björck (2000) tested rolled oats in 10 healthy people (5 men and 5 women). Thin flakes (0.5 mm), including flakes processed under conditions simulating commercial production, gave high glucose and insulin responses (glycemic index 88–118), no different from white wheat bread. Thick flakes (1.0 mm) gave significantly lower responses (glycemic index 70–78). The in-vitro starch hydrolysis rate across oat product formats ranges from far slower for intact oat groats to far faster for instant oat flakes. The in-vivo glycemic response tracked this rate almost perfectly. The implication is that even if beta-glucan viscosity were preserved (which it generally is not in instant forms), the gelatinized starch would still produce a rapid glucose excursion simply because alpha-amylase has direct, unrestricted access to amylose and amylopectin substrate.
Cooking and cooling produces a partial reversal — some of the gelatinized starch recrystallizes into "retrograded starch" (RS3), which is resistant to amylase. Overnight oats (uncooked rolled oats soaked in liquid in the refrigerator) preserve more crystalline starch than freshly hot-cooked porridge; cooked-then-refrigerated leftover oats develop measurable resistant starch. Both produce slightly lower glycemic responses than freshly cooked equivalents, though the effect size is modest (5–10 GI points).
The Second-Meal Effect on Lunch Glycemia
Wolever and colleagues described the "second-meal effect" in a series of trials in the 1980s and 1990s: a low-GI meal (such as oat porridge) produces lower postprandial glucose excursion not only at that meal but also at the next meal, several hours later. The 1988 Wolever paper (Am J Clin Nutr 48:1041) tested the effect overnight: normal subjects ate low- or high-GI dinners of the same nutrient composition, and their blood-sugar response to a standard breakfast the next morning was significantly lower after the low-GI dinners. Dinners with different fiber contents but the same GI made no difference to the breakfast response.
The mechanism was initially attributed to slow nutrient absorption persisting from breakfast into the lunch interval, but subsequent work clarified that the primary driver is colonic fermentation of beta-glucan and resistant starch by gut bacteria, producing short-chain fatty acids (SCFAs) — primarily acetate, propionate, and butyrate — that are absorbed across the colonic epithelium and reach the liver via the portal vein. Propionate in particular inhibits hepatic gluconeogenesis and improves insulin sensitivity. Butyrate signals through GPR43 to stimulate glucagon-like peptide-1 (GLP-1) secretion from intestinal L-cells, augmenting glucose-stimulated insulin release.
The practical implication is that the glycemic benefit of a low-GI oat breakfast is not confined to the morning but extends through the day — particularly useful for individuals with type 2 diabetes seeking to flatten their daily glucose profile. People who track their blood sugar with continuous glucose monitors (CGMs) report ~15–25% less time above range during the breakfast-to-lunch interval and a carryover effect into the early afternoon; these are user reports, not trial results.
Trial Evidence in Type 2 Diabetes and Raised Blood Pressure (Hou 2015, Tappy 1996, Maki 2007)
Hou et al. 2015 (Nutrients 7:10369) pooled fourteen controlled trials and two uncontrolled observational studies of oat intake in people with type 2 diabetes. Compared with the controls, oats lowered hemoglobin A1c (HbA1c) by 0.42% (95% confidence interval 0.23 to 0.61), fasting blood glucose by 0.39 mmol/L, total cholesterol by 0.49 mmol/L and LDL cholesterol by 0.29 mmol/L. Oatmeal also lowered the immediate after-meal glucose and insulin rise compared with the control meals. The 0.42% reduction in HbA1c is a clinically meaningful effect on the same order as a low-dose oral glycemic agent. The authors called for further studies of oats in type 1 diabetes and of the safety of oat intake.
Reductions in fasting insulin and in glucose after an oral glucose tolerance test (OGTT) have also been reported. The largest effects were seen in trials using whole-oat or oat-bran forms; trials using instant or extruded oat products showed smaller or null effects, consistent with the viscosity-mechanism story.
Tappy et al. 1996 (Diabetes Care 19:831) gave eight people with type 2 diabetes (then called non-insulin-dependent diabetes, NIDDM) an extruded breakfast cereal made with oat bran, containing 4.0, 6.0 or 8.4 g of beta-glucan, each with 35 g of carbohydrate, and compared it with a continental breakfast of bread, milk, cheese and ham. The highest rise in blood glucose after the cereal was 67%, 42% and 38% of the rise after the continental breakfast for the three doses, and the glucose peak and area fell in a straight line as the dose rose. The insulin rise was 59–67% as high as after the continental breakfast at all three doses, so it did not change with dose. The authors estimated that about 5 g of beta-glucan halves the glucose response to 35 g of carbohydrate.
Jenkins et al. 2002 (Eur J Clin Nutr 56:622) tested oat foods in 16 people with type 2 diabetes. A prototype breakfast cereal and a bar, both high in beta-glucan, had glycemic indexes of 52 and 43, against 86 for a commercial oat-bran breakfast cereal and 100 for white bread. In a 50 g carbohydrate portion, each gram of beta-glucan lowered the glycemic index by about 4 units.
Maki et al. 2007 (Eur J Clin Nutr 61:786) was not a diabetes trial. It randomly assigned 97 men and women with raised blood pressure to foods containing oat beta-glucan or to control foods for 12 weeks. Peak insulin and the area under the insulin curve after standard breakfasts fell in the beta-glucan group and stayed essentially unchanged in the control group. Blood pressure did not differ between the groups overall, but in participants with a body mass index above 31.5 kg/m2, systolic pressure fell by 8.3 mm Hg and diastolic by 3.9 mm Hg compared with controls.
Oat benefits in type 2 diabetes extend beyond the immediate postprandial response to broader insulin-sensitivity improvements over weeks of intake. Whole-grain interventions for cardiovascular and metabolic outcomes show consistent glycemic improvements with whole-form oats and the absence of clear benefit from highly processed oat products.
Insulin Response Distinct from Glucose Response
The "insulin index" of foods, developed by Holt, Brand-Miller, and Petocz (Am J Clin Nutr 1997) extends the glycemic index concept by measuring the actual insulin secretion produced by a standardized food load rather than the resulting glucose excursion. For most foods, insulin index and glycemic index correlate tightly — high-GI foods produce high insulin responses. Oat porridge sits in the middle of this correlation, with insulin index roughly tracking its glycemic index.
The clinically interesting deviation is that oats produce a noticeably lower insulin response per unit glucose excursion compared with refined-carbohydrate equivalents. This is consistent with the slower glucose-delivery kinetics — the pancreas does not need to mount as aggressive an insulin response to clear glucose that is arriving gradually. For individuals with insulin resistance, this matters: chronic hyperinsulinemia is both a marker of and a driver of progressive metabolic dysfunction, and reducing the insulin burden per meal is a meaningful intervention.
The corollary is that for individuals trying to lose weight via low-insulinemic eating patterns (ketogenic, very-low-carb, or intermittent fasting protocols), even whole oats produce a substantial insulin response and may not fit well. Oats fit type 2 diabetes eating plans that count carbohydrates, but they do not fit a ketogenic carbohydrate budget — a single half-cup of cooked oats delivers 25–30 g of net carbohydrate, far above the typical ketogenic-diet carbohydrate budget.
The Oat Milk Paradox — Why "Oats" in Liquid Form Are High GI
Commercial oat milk has experienced explosive consumer growth as a dairy alternative, often marketed with the implication that it inherits the cardiometabolic benefits of whole oats. It largely does not. The manufacturing process is the problem.
Commercial oat-milk production typically involves: soaking oats in water, blending, and then treating the slurry with alpha-amylase to break down starch and reduce viscosity (which would otherwise produce a slimy, unpalatable mouthfeel). The enzyme treatment also liberates free maltose and glucose, which produces the noticeably sweet taste of unsweetened oat milk and explains its relatively high natural sugar content (typically 7–15 g of sugar per cup, even in unsweetened varieties). The slurry is then filtered to remove the insoluble bran fraction, discarding most of the original beta-glucan, vitamins, and minerals. The remaining liquid is fortified with calcium, vitamin D, and vitamin B12 to approximate dairy milk's nutrient profile.
The result is a liquid that is essentially water plus enzymatically liberated glucose and maltose, with minimal residual beta-glucan and very low molecular weight in what does remain. The glycemic index of commercial oat milk has been measured at 60–78 depending on brand and formulation — substantially higher than whole milk (GI ~30), soy milk (GI ~34), or unsweetened almond milk (GI ~25).
For individuals concerned with glycemic control, this matters: a typical 12 oz coffee with 4 oz oat milk delivers ~5–7 g of rapidly absorbed sugar, equivalent to adding about 1.5 teaspoons of sucrose to the cup. By the glycemic index figures above, whole dairy milk and unsweetened almond milk raise blood sugar far less.
What Continuous Glucose Monitor Users Report
Consumer continuous glucose monitors have produced a large body of self-experimentation by users on real-world glycemic responses to oat-based meals. The figures below are what users commonly report, not results from controlled studies (users are self-selected and vary widely from person to person):
- Plain steel-cut or rolled oats cooked in water: peak glucose rise of 30–50 mg/dL above baseline in most metabolically healthy adults, returning to baseline within 2 hours. Diabetics show larger peaks (60–100 mg/dL) but proportionally similar response shape.
- Same oats with added protein (Greek yogurt, eggs on the side, protein powder stirred in): peak reduced by 15–30 mg/dL, with faster return to baseline.
- Same oats with added fat (nut butter, full-fat dairy): peak reduced by 10–20 mg/dL, with slightly delayed but lower peak.
- Instant oatmeal packet with added brown sugar/raisins: peak 80–130 mg/dL above baseline in healthy adults, often producing reactive hypoglycemia 3–4 hours later.
- Oat-milk latte (no added sugar): peak 25–45 mg/dL above baseline, comparable to drinking ~1 tablespoon of sugar dissolved in coffee.
The inter-individual variability is large — some metabolically healthy individuals show essentially flat CGM traces after instant oatmeal while others show substantial excursions after steel-cut oats. Only a person's own CGM trace shows that person's own response curve. Users with diabetes report that switching from instant to steel-cut oats, plus adding protein and fat to the meal, cuts breakfast-meal time above range by 30–50% on their CGM traces.
Combining With Protein and Fat to Flatten the Curve Further
Protein and fat both slow gastric emptying and amplify the glucagon-like peptide-1 incretin response. Adding either to an oat meal further flattens the postprandial glucose curve beyond what beta-glucan viscosity achieves alone. Combinations that users commonly report as producing flat CGM traces in metabolically healthy adults:
- Steel-cut oats + 2 scrambled eggs + 1 tbsp ghee on the side — the protein and fat envelope the slower-absorbing oat carbohydrate; total carbohydrate load remains modest at ~30 g.
- Rolled oats cooked in whole milk, topped with 2 tbsp almond butter and a handful of berries — the dairy fat and almond fat dominate the meal composition and bring the meal's effective GI down further; berry polyphenols may add a small alpha-amylase inhibition effect.
- Overnight oats made with Greek yogurt and chia seeds, with cinnamon — the yogurt protein (~15–20 g) drives insulin sensitivity at the next-meal interval; cinnamon at > 1 tsp/day has modest insulin-sensitizing effects in some trials.
Combinations that users report as producing glucose spikes even with whole-form oats:
- Oats + banana + honey/maple syrup + dried fruit (compounds 4 separate rapidly-absorbed sugar sources on top of the oat carbohydrate)
- Oats made with sweetened oat milk plus added brown sugar
- "Oat smoothies" blended with banana, dates, and fruit juice (blending mechanically pre-digests the oats and any added fruit)
The general principle is that the underlying oat carbohydrate is moderately glycemic; what is added to or removed from the meal determines whether the final result is a flat or steep curve.
Cautions
- Oats are not a free carbohydrate for insulin-resistant or pre-diabetic patients aiming for tight glycemic control. They are a better carbohydrate than refined alternatives, but a typical bowl still delivers 25–35 g of net carbohydrate that will raise blood glucose meaningfully.
- Children with reactive hypoglycemia or symptomatic glucose excursions often do worse on instant flavored oatmeal than on a savory protein breakfast. The added sugars and degraded molecular structure compound the problem.
- Oats raise glucose in type 1 diabetes as predictably as any whole grain — carbohydrate counting and insulin dosing apply normally.
- Oats do not fit ketogenic diets at typical serving sizes; even a half-cup of cooked oats exceeds the daily net-carb budget for most ketogenic protocols.
- Postprandial fatigue ("food coma") after large bowls of oats — particularly instant forms — often reflects a sharp glucose excursion followed by reactive insulin response and rebound hypoglycemia. People describe the symptom easing after switching to steel-cut oats and adding protein.
Key Research Papers
- Atkinson FS, Foster-Powell K, Brand-Miller JC, international tables of glycemic index and glycemic load values 2008 (Diabetes Care 2008;31:2281-3) — PubMed PMID: 18835944
- Hou Q, Li Y, Li L et al., the metabolic effects of oats intake in patients with type 2 diabetes, systematic review and meta-analysis (Nutrients 2015;7:10369-87) — PubMed PMID: 26690472
- Maki KC, Galant R, Samuel P, Tesser J et al., effects of consuming foods containing oat beta-glucan on blood pressure carbohydrate metabolism and biomarkers of oxidative stress in men and women with elevated blood pressure (Eur J Clin Nutr 2007;61:786-95) PubMed PMID: 17151592
- Tappy L, Gugolz E, Wursch P, effects of breakfast cereals containing various amounts of beta-glucan fibers on plasma glucose and insulin responses in NIDDM subjects (Diabetes Care 1996;19:831-4) PubMed PMID: 8842600
- Wolever TM, Tosh SM, Gibbs AL et al., physicochemical properties of oat beta-glucan influence its ability to reduce serum LDL cholesterol in humans (Am J Clin Nutr 2010;92:723-32) — PubMed PMID: 20660224
- Tosh SM, review of human studies investigating the post-prandial blood-glucose lowering ability of oat and barley food products (Eur J Clin Nutr 2013;67:310-7) — PubMed PMID: 23422921
- Jenkins AL, Jenkins DJ, Zdravkovic U, Wursch P, Vuksan V, depression of the glycemic index by high levels of beta-glucan fiber in two functional foods (Eur J Clin Nutr 2002;56:622-8) PubMed PMID: 12080401
- Holt SH, Brand Miller JC, Petocz P, an insulin index of foods, the insulin demand generated by 1000 kJ portions of common foods (Am J Clin Nutr 1997;66:1264-76) — PubMed PMID: 9356547
- Wolever TM, Jenkins DJ, Ocana AM et al., second-meal effect, low-glycemic-index foods eaten at dinner improve subsequent breakfast glycemic response (Am J Clin Nutr 1988;48:1041-7) PubMed PMID: 2844076
- Granfeldt Y, Eliasson AC, Björck I, an examination of the possibility of lowering the glycemic index of oat and barley flakes by minimal processing (J Nutr 2000;130:2207-14) — PubMed PMID: 10958814
- Regand A, Tosh SM, Wolever TM, Wood PJ, physicochemical properties of beta-glucan in differently processed oat foods influence glycemic response (J Agric Food Chem 2009;57:8831-8) — PubMed PMID: 19728711
- Steinert RE, Raederstorff D, Wolever TM, effect of consuming oat bran mixed in water before a meal on glycemic responses in healthy humans (Nutrients 2016;8:524) PubMed PMID: 27571099
- Zurbau A, Noronha JC, Khan TA, Sievenpiper JL, Wolever TMS, the effect of oat beta-glucan on postprandial blood glucose and insulin responses, a systematic review and meta-analysis (Eur J Clin Nutr 2021;75:1540-54) — PubMed PMID: 33608654
- Musa-Veloso K, Noori D, Venditti C, Poon T, Johnson J, Harkness LS, O'Shea M, Chu Y, a systematic review and meta-analysis of randomized controlled trials on the effects of oats and oat processing on postprandial blood glucose and insulin responses (J Nutr 2021;151:341-51) — PubMed PMID: 33296453