Sodium
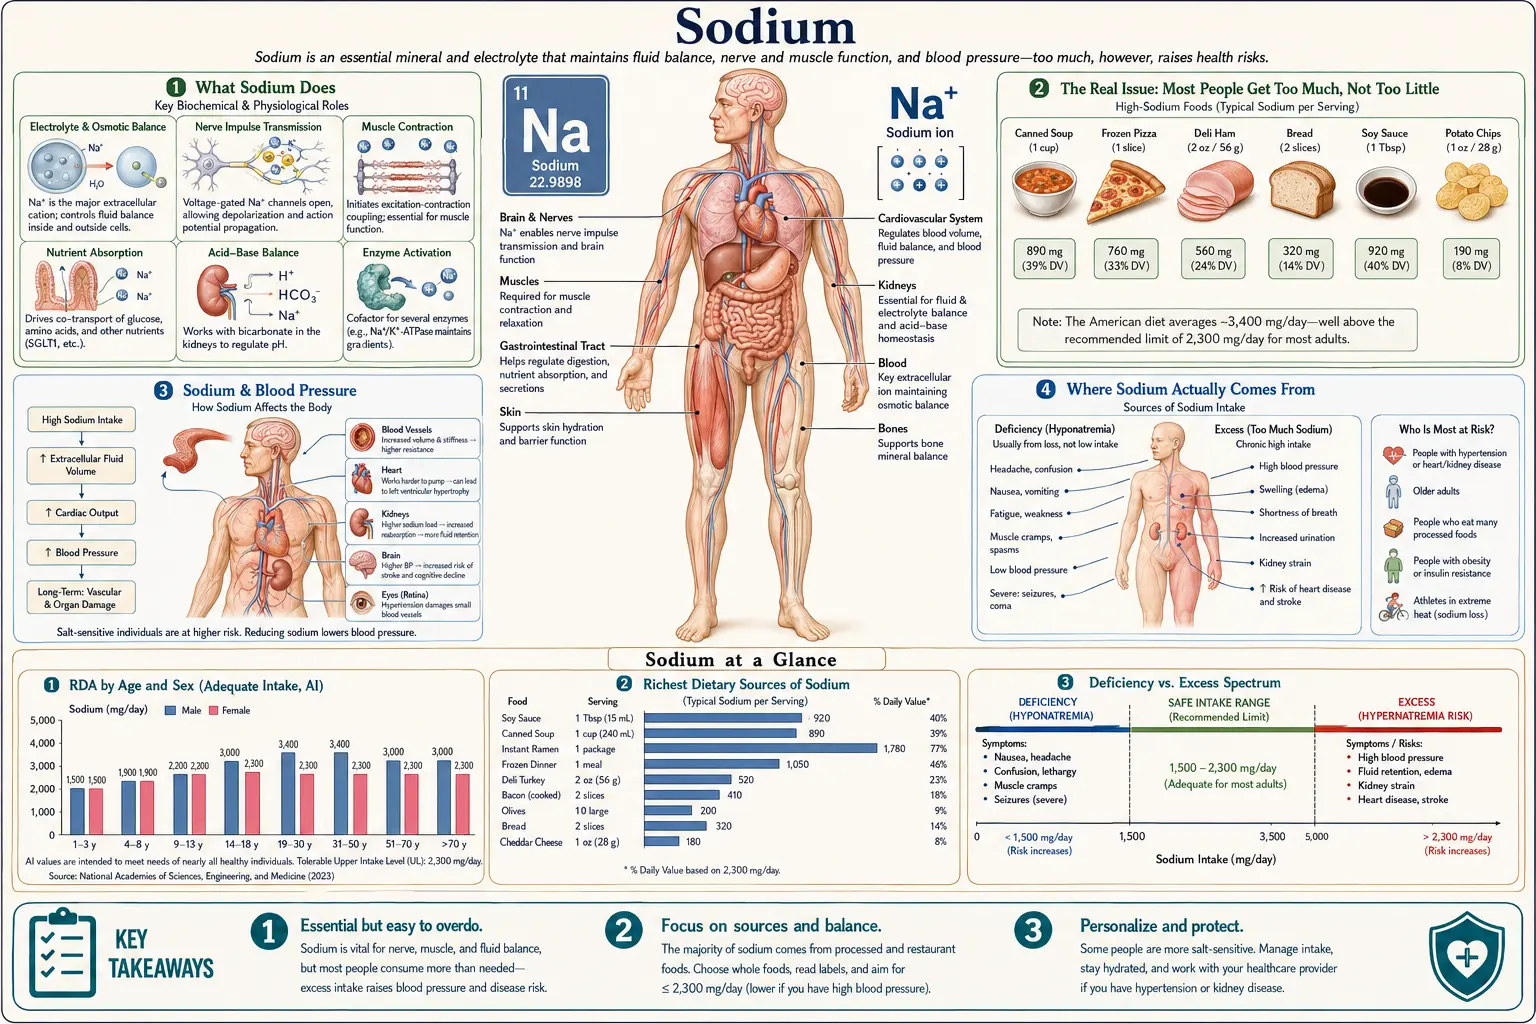
Sodium is one of the most misunderstood nutrients in the human diet. It is genuinely essential — your body cannot function without it — yet most people in the United States and other industrialized countries consume far more than they need, and that excess is one of the most well-documented dietary contributors to high blood pressure, heart disease, and stroke. This page lays out the honest, evidence-based picture: why you need sodium, why "too much" is the real public-health problem for most people, what the science actually says about blood pressure (including the parts that are still debated), where sodium hides in everyday food, and the ways people bring their intake down without making meals taste like cardboard.
Interactive Visualization How Your Body Controls Blood Pressure Watch the kidney fire renin, angiotensin clamp the arteries, and aldosterone hold sodium — then eat salt, or take an angiotensin-converting enzyme inhibitor (ACE inhibitor). Launch → Interactive Visualization The Sodium–Potassium Pump — why you have a voltage Run the pump that gives every cell its charge — three sodium out, two potassium in, on Mg-ATP — then drop the magnesium and see exactly why low potassium refuses to correct. Launch → Interactive Visualization Thirst, ADH & Water Balance — guard the body's water Get dehydrated and watch osmoreceptors fire thirst and ADH, opening aquaporins so the kidney reclaims water — then lose ADH in diabetes insipidus and watch the urine run clear. Launch → Interactive Visualization Sweat & Cooling — evaporate heat off the skin Overheat and watch millions of glands pump sweat that cools you only as it evaporates — then crank up the humidity so it can't evaporate, the core climbs, and the body tips toward heat stroke. Launch → Interactive Visualization Osmosis and Tonicity: Why Cells Swell or Shrink Drop a cell into salty or plain water and watch it shrivel or burst as water chases solute — then see why an intravenous (IV) bag has to be mixed to just the right strength. Launch →
Table of Contents
What Sodium Does
Sodium is an electrolyte — a mineral that carries an electrical charge when dissolved in body fluid. It is the main positively-charged particle in the fluid outside your cells (the blood and the fluid bathing your tissues), and your body keeps its concentration within a tight, carefully regulated range. Life literally depends on it.
Sodium does several critical jobs:
- Fluid balance. Sodium acts like a sponge for water. Where sodium goes, water follows. By controlling how much sodium is in your bloodstream and tissues, your body controls how much water stays in your blood versus your cells — keeping you neither dried out nor waterlogged.
- Blood volume and blood pressure. Because sodium pulls water into the bloodstream, it directly affects how much blood is circulating. More sodium tends to mean more fluid volume, which is part of how sodium influences blood pressure.
- Nerve impulses. Every thought, sensation, and reflex travels along your nerves as a tiny electrical signal. That signal is created by sodium rushing into nerve cells. Without sodium, your nervous system simply could not send messages.
- Muscle contraction. The same electrical signaling lets your muscles contract — including your heart, which beats because of carefully timed flows of sodium, potassium, and calcium.
So sodium is never meant to be eliminated. The guidance is about the right amount — and for most people, the official limit is below what they currently eat, not above it.
The Real Issue: Most People Get Too Much, Not Too Little
Here is the key reframe. For the average healthy person eating a typical modern diet, true sodium deficiency from food alone is rare, while the opposite — getting far too much — is the norm: U.S. adults average about 3,400 mg of sodium per day, and roughly 9 out of 10 Americans exceed the recommended limit. That is why the entire public-health conversation around sodium is about reducing intake; the modern food supply delivers so much of it, so easily, that overconsumption has become the default and quietly pushes blood pressure up across an entire population.
Too little or too much sodium both cause problems. For a full, patient-friendly guide to the symptoms, causes, and treatment of each, see Hyponatremia (Low Sodium) and Hypernatremia and Salt Excess. Related deep dives: Dizziness from Low Sodium, Low Sodium, Renin, and Heart Rhythm, Table Salt, Sea Salt, and Iodine, and Baking Soda vs Table Salt as a Sodium Source.
Sodium & Blood Pressure
The link between high sodium intake and higher blood pressure is one of the most thoroughly studied relationships in nutrition science, and the core finding is consistent: for most people, eating less sodium lowers blood pressure.
What the controlled trials show
The landmark DASH-Sodium trial (Sacks and colleagues, 2001) is among the strongest evidence. Researchers fed participants carefully controlled diets and varied the sodium level. Cutting sodium lowered blood pressure on both a typical American diet and the produce-rich DASH diet — and the combination of a low-sodium DASH diet produced the biggest drop, especially in people who already had high blood pressure. Large reviews of randomized trials, including a Cochrane systematic review (He, Li, and MacGregor, 2013) and a BMJ meta-analysis (Aburto and colleagues, 2013), found that even a modest reduction in salt produces measurable reductions in blood pressure in both people with and without hypertension. The Cochrane review (34 trials, 3,230 participants) found no significant change in blood fats, along with small rises in the hormones renin, aldosterone and noradrenaline; the BMJ meta-analysis found no significant adverse effect on blood fats, catecholamine (stress-hormone) levels or kidney function.
Salt sensitivity: it varies by person
Not everyone's blood pressure responds to sodium the same way. This is called salt sensitivity, and it differs from person to person. Blood pressure tends to be more sensitive to sodium in:
- Older adults (sensitivity generally increases with age);
- Black adults, in whom salt sensitivity is notably more common;
- People who already have high blood pressure, as well as those with chronic kidney disease, diabetes, or metabolic syndrome.
For these groups, reducing sodium tends to have the largest payoff. People who are "salt-resistant" may see smaller changes — but there is no easy home test to know which group you fall into, which is part of why population-wide guidance leans toward moderation.
An honest note on the low-intake debate
Here is the genuine nuance. While the harms of high sodium are well established, there is real scientific debate about whether pushing intake to very low levels offers additional benefit — or could even be counterproductive for some people. The large international PURE study (O'Donnell, Mente, and colleagues, 2014) estimated sodium intake from morning fasting urine samples in 101,945 people in 17 countries and reported a "J-shaped" or "U-shaped" pattern. Compared with an estimated 4.00 to 5.99 g of sodium a day, the risk of death and major cardiovascular events was higher at 7 g a day or more (odds ratio 1.15) and also higher below 3 g a day (odds ratio 1.27); the lowest risk was at an estimated 3 to 6 g a day. PURE's "low" group therefore still sat above the 2,300 mg (2.3 g) U.S. limit.
This finding is genuinely contested. Critics point to methodological concerns — for example, PURE estimated sodium intake from a single morning urine sample rather than the gold-standard repeated 24-hour collections, and reverse causation is hard to rule out (people who are already sick may eat less). Major bodies including the World Health Organization and American Heart Association maintain that the bulk of evidence still supports reducing intake for the large majority of people who currently consume too much. In short: the J-curve debate concerns intakes below about 3 g of sodium a day and does not show any benefit from a high-salt diet — in PURE itself, risk was also higher at 7 g a day or more. For the ~90% of Americans eating above the guideline, the WHO and AHA read the evidence as pointing toward eating less.
Where Sodium Actually Comes From
Most people picture the salt shaker as the culprit. It usually isn't. According to the U.S. Centers for Disease Control and Prevention (CDC) and American Heart Association, more than 70% of the sodium Americans eat comes from packaged, processed, and restaurant foods — added long before the food reaches your table. Salt added during home cooking and at the table accounts for a much smaller share.
The biggest contributors are often foods that don't even taste especially salty, because sodium is spread across so many everyday items. The American Heart Association nicknames the top offenders the "Salty Six":
- Breads and rolls — individually low in sodium, but eaten so often they become the single largest source for many people;
- Pizza — a single slice can carry well over 1,000 mg;
- Sandwiches and burgers — bread plus cured meat plus condiments adds up fast;
- Cold cuts and cured meats — deli turkey, ham, salami, bacon;
- Soups — especially canned and restaurant varieties;
- Savory snacks — chips, crackers, pretzels — plus cheeses and many sauces, dressings, and condiments.
Because so much sodium is hidden, the Nutrition Facts label is the main way to see it. It lists the milligrams of sodium per serving — and the serving size, which is often smaller than the amount people actually eat. As a quick rule of thumb, a food with 5% or less of the Daily Value for sodium is low, and 20% or more is high.
The Sodium-Potassium Balance
Sodium doesn't act alone. It works in partnership with potassium, its electrolyte counterpart. In many ways the two pull in opposite directions: sodium tends to raise blood pressure, while potassium tends to relax blood vessels and help the kidneys clear excess sodium. A growing body of evidence suggests that the ratio of the two may matter as much as — or more than — sodium alone. In a large U.S. study (Yang and colleagues, 2011), a high sodium-to-potassium ratio was more strongly linked to cardiovascular and all-cause mortality than high sodium or low potassium considered separately.
The trouble is that the modern diet has the balance backwards. For most of human history, people ate diets that were low in sodium and high in potassium — lots of plants, little processing. Today's typical pattern is the reverse: high in sodium and low in potassium, driven by processed food on one side and too few fruits and vegetables on the other.
Improving the ratio has two parts: less processed sodium and more potassium-rich whole foods — things like potatoes and sweet potatoes, beans and lentils, leafy greens, bananas, avocados, tomatoes, citrus, and yogurt. (You can read more on our Potassium page.) One important safety fact: in people with kidney disease, or taking medicines that make the body hold on to potassium — angiotensin-converting enzyme (ACE) inhibitors, angiotensin receptor blockers (ARBs) and potassium-sparing diuretics — extra potassium can build up in the blood (hyperkalemia), which can disturb the heart's rhythm. The lisinopril (ACE inhibitor) label lists kidney problems, diabetes, potassium-sparing diuretics, potassium supplements and potassium-containing salt substitutes as risk factors for hyperkalemia.
How Much You Need
There are a few different numbers, and it helps to understand what each one means:
- Adequate Intake (~1,500 mg/day): The National Academies of Sciences, Engineering, and Medicine set an Adequate Intake of 1,500 mg of sodium per day for most adults — roughly the amount needed to cover basic physiological needs in a generally inactive, temperate-climate adult.
- Upper guideline (<2,300 mg/day): The Dietary Guidelines for Americans and the National Academies' "Chronic Disease Risk Reduction" intake recommend that adults limit sodium to less than 2,300 mg per day — about the amount in one teaspoon of table salt. Most Americans, at ~3,400 mg, are well over this.
- The American Heart Association's ideal (<1,500 mg/day): The American Heart Association recommends no more than 2,300 mg a day and an ideal limit of less than 1,500 mg per day for most adults, particularly those who already have high blood pressure.
The American Heart Association (AHA) points out that for most people, cutting about 1,000 mg a day from current intake can meaningfully improve blood pressure and heart health.
Who Is Most Affected (Both Ways)
Sodium is a "Goldilocks" nutrient — the right amount depends on who you are. For most people the guidance points lower, but a smaller group can run short of it.
People for whom high sodium carries the most risk
- High blood pressure (hypertension) — the group with the most to gain from cutting back;
- Heart failure — excess sodium causes fluid retention that strains the heart and worsens symptoms;
- Chronic kidney disease — damaged kidneys struggle to clear sodium and fluid;
- Salt-sensitive individuals — including, on average, older adults and Black adults.
People who can run short of sodium
- Endurance athletes and heavy sweaters. Sweat contains sodium, and people doing long or intense exercise in the heat can lose substantial amounts. A specific danger here is exercise-associated hyponatremia — dangerously low blood sodium that occurs mainly when athletes drink too much plain water during long events, diluting the sodium in their blood. It can cause confusion and seizures, which are emergency signs, and in severe cases it can be fatal. The usual guidance is to drink to thirst rather than overdrinking, and to use electrolyte-containing fluids during prolonged exertion.
- Certain medical conditions such as Addison's disease (adrenal insufficiency), in which the body loses too much sodium, as well as some other conditions and medications that waste salt. In Addison's disease the missing adrenal hormones are replaced with medicine.
- Very low-carbohydrate or ketogenic diets. These diets cause the kidneys to excrete more sodium and water, so people on them can run short of sodium, with symptoms like fatigue, headache, and lightheadedness (sometimes called the "keto flu").
The bottom line: for healthy, active people outside these special situations, normal dietary sodium is not the concern — the research points at the excess hidden in processed food.
Lowering Sodium Without Losing Flavor
The good news is that reducing sodium does not have to mean bland food. Flavor and salt are not the same thing, and taste actually recalibrates over time. The common approaches:
- Cooking more whole foods at home. Since 70%+ of sodium comes pre-added to packaged and restaurant food, meals cooked at home are where the cook controls the salt.
- Seasoning with flavor, not just salt. Herbs, spices, garlic, onion, ginger, black pepper, chili, vinegar, and a squeeze of citrus build taste. Acid and aromatics make food taste vivid without sodium. A splash of lemon or lime can make under-salted food taste "finished."
- Rinsing canned foods. Draining and rinsing canned beans, vegetables, or tuna under water can wash away a meaningful portion of the added sodium.
- Reading the labels. Products are marked "no salt added," "low sodium," or "reduced sodium," and sodium content for the same food can vary enormously between products. Broths, sauces, dressings, condiments, and bread are common hidden sources.
- Cutting back gradually — taste buds adapt. When salt is reduced slowly over a few weeks, the palate adjusts, and foods you once found normal will start to taste too salty. The preference for salt is largely learned, which means it can be unlearned.
- Potassium salt substitutes. Potassium-based salt substitutes lower sodium while raising potassium, but they are not safe for everyone: in people with kidney disease, or taking ACE inhibitors, ARBs or potassium-sparing diuretics, the extra potassium can build up in the blood (hyperkalemia) and disturb the heart's rhythm.
Key Research Papers
- Sacks FM, Svetkey LP, Vollmer WM, et al. (2001). Effects on Blood Pressure of Reduced Dietary Sodium and the Dietary Approaches to Stop Hypertension (DASH) Diet. New England Journal of Medicine, 344(1):3–10. — The DASH-Sodium trial: cutting sodium lowered blood pressure on both a typical diet and the DASH diet, with the largest drop from combining low sodium with the DASH diet. — doi:10.1056/NEJM200101043440101
- He FJ, Li J, MacGregor GA (2013). Effect of longer term modest salt reduction on blood pressure: Cochrane systematic review and meta-analysis of randomised trials. BMJ, 346:f1325. — Pooling 34 trials, even a modest, sustained cut in salt produced significant blood-pressure reductions in people with and without hypertension. — doi:10.1136/bmj.f1325
- Aburto NJ, Ziolkovska A, Hooper L, et al. (2013). Effect of lower sodium intake on health: systematic review and meta-analyses. BMJ, 346:f1326. — WHO-commissioned review: lower sodium reduced blood pressure with no adverse effect on blood lipids or kidney function, and higher intake was associated with greater stroke and heart-disease risk. — doi:10.1136/bmj.f1326
- O'Donnell M, Mente A, Rangarajan S, et al. (2014). Urinary Sodium and Potassium Excretion, Mortality, and Cardiovascular Events. New England Journal of Medicine, 371(7):612–623. — The PURE study, central to the "J-curve" debate: risk was highest at very high sodium intake but also appeared elevated at the very lowest intakes; interpretation remains contested due to single-sample estimation and possible reverse causation. — doi:10.1056/NEJMoa1311889
- Yang Q, Liu T, Kuklina EV, et al. (2011). Sodium and Potassium Intake and Mortality Among US Adults. Archives of Internal Medicine, 171(13):1183–1191. — A high sodium-to-potassium ratio was more strongly associated with cardiovascular and all-cause mortality than sodium or potassium alone, highlighting that the balance matters. — doi:10.1001/archinternmed.2011.257
- National Academies of Sciences, Engineering, and Medicine (2019). Dietary Reference Intakes for Sodium and Potassium. — Sets the Adequate Intake at 1,500 mg/day and introduces a Chronic Disease Risk Reduction intake of 2,300 mg/day for adults.
- American Heart Association (2024). How Much Sodium Should I Eat Per Day? — Recommends no more than 2,300 mg/day with an ideal limit of 1,500 mg/day for most adults, and notes that more than 70% of dietary sodium comes from packaged and restaurant foods.
Connections
- Fake Meat — The sodium in processed meat and in processed meat alternatives, compared
- All Minerals
- Hydration — electrolytes without the sports-drink hype
- DASH Diet — the mineral-rich eating pattern built around this nutrient
- Osmosis and Tonicity: Why Cells Swell or Shrink — interactive animation
- Sweat: How Your Body Cools Itself — interactive animation
- Thirst, ADH & How Your Body Guards Its Water — interactive animation
- The Sodium–Potassium Pump — interactive animation
- How Your Body Controls Blood Pressure — interactive animation
- Hyponatremia (Low Sodium): Symptoms, Causes, and Recovery
- Hypernatremia and Salt Excess: Symptoms, Causes, and Risks
- Hyponatremia (Low Sodium): Dizziness
- Low Sodium, Renin, and Heart Rhythm
- Table Salt, Sea Salt, and Iodine
- Baking Soda vs Table Salt as a Sodium Source
- Potassium
- Magnesium
- Calcium
- Mediterranean Diet
- Kidney Function
- Glauber's Salt (Sodium Sulfate) — the saline osmotic laxative still used in bowel prep
- Salt in Socks — the topical salt remedy, and the backwards dietary-sodium claims attached to it
- Baking Soda