Calcium: Food Sources & Daily Intake
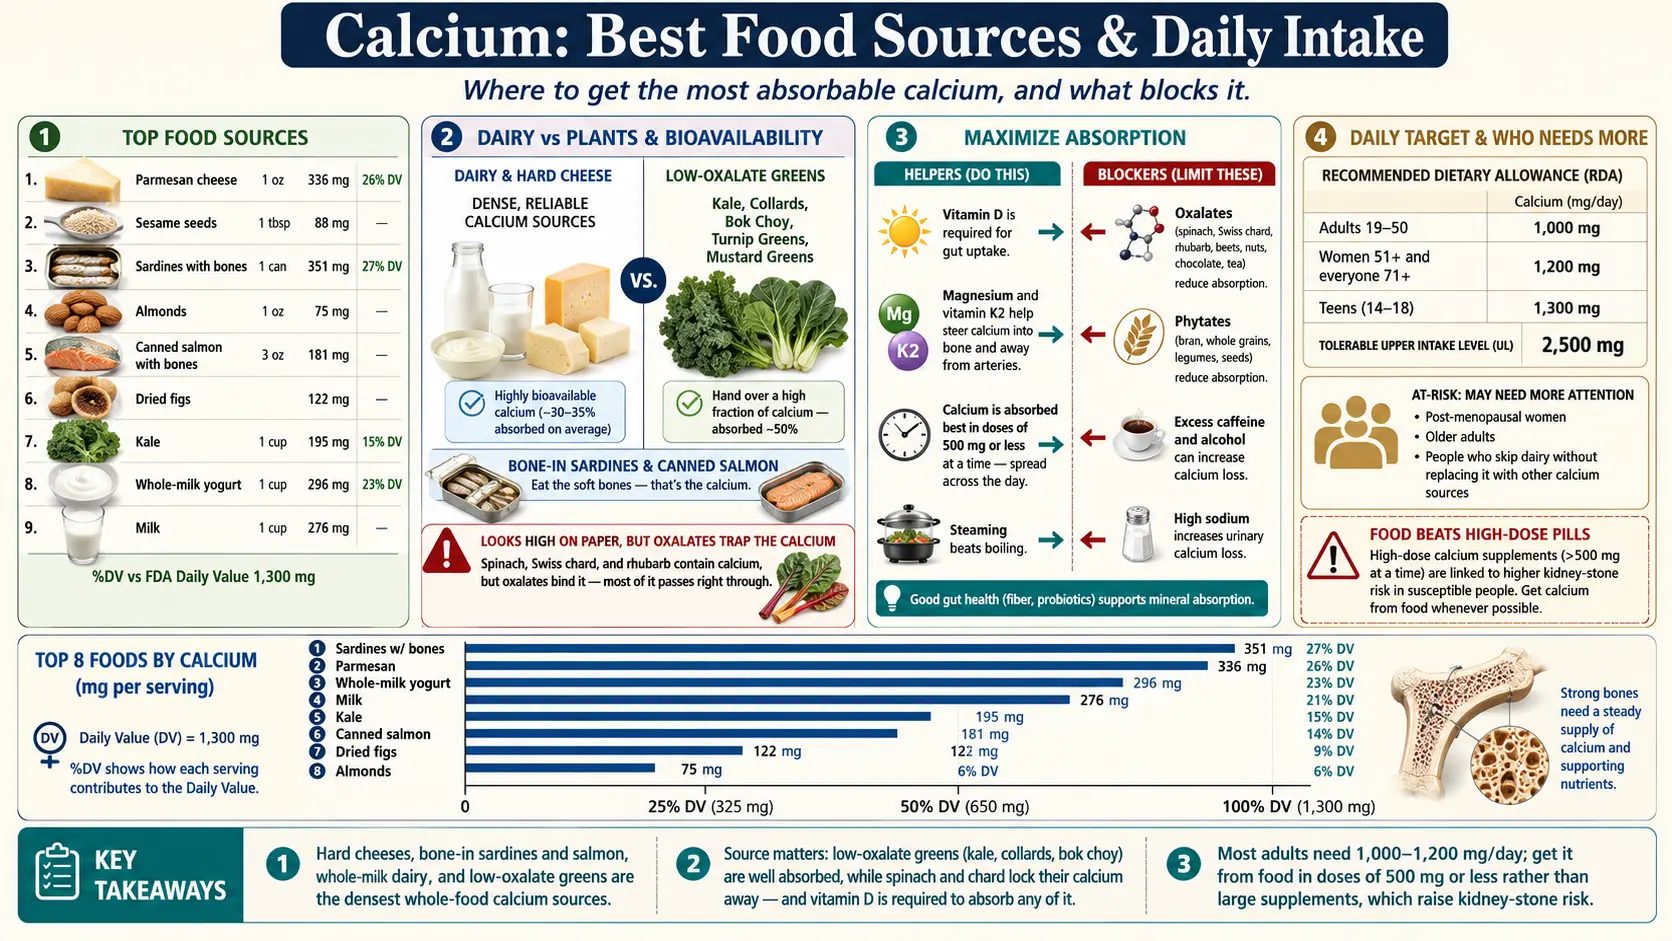
Calcium is the most abundant mineral in the body, and about 99% of it sits in the bones and teeth, where it doubles as a structural material and a reserve the body can draw on. The remaining 1% in blood and soft tissue takes part in nerve impulse transmission, muscle contraction, the constriction and relaxation of blood vessels, hormone secretion and blood clotting. In the USDA figures below, hard cheeses and whole sesame seeds carry the most calcium per 100 g, followed by sardines and canned salmon eaten with their bones, almonds, dried figs and cooked leafy greens; whole milk and whole-milk yogurt carry 113–121 mg per 100 g. How much of that calcium is absorbed differs from food to food, because oxalate in some plants binds it (see below).
| Calcium: Food Sources & Daily IntakeCalcium, glucose and fructose per 100 g from USDA FoodData Central (SR Legacy); %DV per 100 g against the 1,300 mg Daily Value in 21 CFR 101.9. — = not reported by USDA. Serving weights are USDA portion weights, shown for reference. | ||||||
|---|---|---|---|---|---|---|
| Rank | Food (serving) | Per 100 g | %DV / 100g | Glucose | Fructose | Notes |
| 1 | Parmesan Cheese (Hard) 1 oz / 28 g | 1,184 mg | 🟢 91% | — | — | The highest per-100 g value in this table. |
| 2 | Sesame Seeds (Whole, Dried) 1 tbsp / 9 g | 975 mg | 🟢 75% | — | — | USDA lists dried, decorticated (hulled) sesame kernels at 60 mg per 100 g. |
| 3 | Cheddar Cheese 1 oz / 28 g | 710 mg | 🟢 55% | 0.3 | 0 | |
| 4 | Sardines (Atlantic, Canned in Oil, With Bones) 1 can / 92 g | 382 mg | 🟡 29% | — | — | Drained solids with bone. |
| 5 | Almonds 1 oz / 28 g | 269 mg | 🟡 21% | 0.2 | 0.1 | About 23 nuts. |
| 6 | Canned Pink Salmon (With Bones) 3 oz / 85 g | 213 mg | 🟡 16% | — | — | Solids with bone and liquid. USDA lists canned pink salmon without skin and bones at 60 mg per 100 g. |
| 7 | Figs (Dried) 1 fig / 8.4 g | 162 mg | 🟡 12% | 24.8 | 22.9 | |
| 8 | Kale (Cooked) 1 cup / 118 g | 150 mg | 🟡 12% | 0.5 | 0.4 | In a study of 11 women, 40.9% of the calcium in kale was absorbed, against 32.1% from milk (Heaney & Weaver, 1990). |
| 9 | Tahini (Sesame Paste) 1 tbsp / 15 g | 141 mg | 🟡 11% | — | — | USDA entry for tahini of unspecified kernel type; its entry for tahini from roasted and toasted kernels lists 426 mg per 100 g. |
| 10 | Collard Greens (Cooked) 1 cup / 190 g | 141 mg | 🟡 11% | — | — | Boiled, drained. |
| 11 | Turnip Greens (Cooked) 1 cup / 144 g | 137 mg | 🟡 11% | — | — | |
| 12 | Plain Yogurt (Whole Milk) 1 cup / 245 g | 121 mg | ⚪ 9% | — | — | |
| 13 | Mustard Greens (Cooked) 1 cup / 140 g | 118 mg | ⚪ 9% | — | — | |
| 14 | Milk (Whole) 1 cup / 244 g | 113 mg | ⚪ 9% | 0 | 0 | |
| 15 | Bok Choy (Cooked) 1 cup / 170 g | 93 mg | ⚪ 7% | — | — | The Linus Pauling Institute describes the calcium in kale-family greens, bok choy among them, as being as bioavailable as the calcium in milk. |
| 16 | Broccoli (Cooked) ½ cup / 78 g | 40 mg | ⚪ 3% | 0.5 | 0.7 | |
| 17 | Beef Kidney (Simmered) 3 oz / 85 g | 19 mg | ⚪ 1% | — | — | Organ meat. |
| 18 | Chicken Giblets (Simmered) 3 oz / 85 g | 14 mg | ⚪ 1% | — | — | Organ meat. |
| 19 | Pork Kidney (Braised) 3 oz / 85 g | 13 mg | ⚪ 1% | — | — | Organ meat. |
| 20 | Brown Rice (Long-Grain, Cooked) 1 cup / 202 g | 3.0 mg | ⚪ 0% | 0 | 0 | Common staple. |
Table of Contents
How to Read These Tables
- Total amount vs. how much you absorb. A food can be high in calcium yet release only a little of it. In isotope studies at Creighton University, healthy adults absorbed 40.9% of the calcium in kale, a low-oxalate green, against 32.1% from milk; from spinach they absorbed 5.1%, against 27.6% from milk. The amount column shows what is in the food, not how much of it is absorbed.
- %DV vs. age-specific intakes. The %DV column compares 100 g of each food against the FDA label Daily Value of 1,300 mg (21 CFR 101.9). The age-specific RDA set by the Institute of Medicine is 1,000 mg for adults 19–50 and men 51–70, 1,200 mg for women over 50 and everyone over 70, and 1,300 mg for ages 9–18 — see the second table.
- Per 100 g vs. per serving. Per-100 g figures compare foods on equal weight; the serving size beside each food is a USDA portion weight, shown because typical portions differ widely (an ounce of cheese is 28 g, a cup of cooked collards 190 g).
Recommended Intakes & Upper Limits
The Institute of Medicine's 2011 intake values depend on age, sex and pregnancy. The Daily Value used for the %DV column above is a single label figure; the table below lists the age-specific values.
| Life stage | RDA / AI (mg/day) | Upper limit (mg/day) |
|---|---|---|
| Infants 0–6 mo | 200* (AI) | 1,000 |
| Infants 7–12 mo | 260* (AI) | 1,500 |
| Children 1–3 y | 700 | 2,500 |
| Children 4–8 y | 1,000 | 2,500 |
| Children 9–13 y | 1,300 | 3,000 |
| Teens 14–18 y | 1,300 | 3,000 |
| Adults 19–50 y | 1,000 | 2,500 |
| Men 51–70 y | 1,000 | 2,000 |
| Women 51–70 y | 1,200 | 2,000 |
| Adults 71+ y | 1,200 | 2,000 |
| Pregnancy / Lactation 14–18 y | 1,300 | 3,000 |
| Pregnancy / Lactation 19–50 y | 1,000 | 2,500 |
Bioavailability & Absorption
Two things shape how much calcium is absorbed. The first is vitamin D: its active form, 1,25-dihydroxyvitamin D (calcitriol), increases the intestinal absorption of calcium. The second is what else is in the food. The Linus Pauling Institute describes oxalate as the most potent inhibitor of calcium absorption, found at high concentrations in spinach and rhubarb and at lower concentrations in sweet potatoes and dried beans, while the calcium in kale-family plants (broccoli, bok choy, cabbage, mustard and turnip greens) is as bioavailable as the calcium in milk. In a randomized cross-over study of 13 healthy adults given 200 mg of labelled calcium, mean absorption was 5.1% from spinach and 27.6% from milk; the spinach tested held slightly more oxalate than needed to bind all of its calcium (Heaney, Weaver & Recker, 1988). Kale, tested the same way in 11 women, gave 40.9% against 32.1% from milk (Heaney & Weaver, 1990). Phytate is a weaker inhibitor; the Linus Pauling Institute notes that only concentrated sources such as wheat bran or dried beans substantially reduce calcium absorption, and that fermentation with yeast breaks phytate down in bread. On dose size, a 1988 study of 21 adults given single loads of 0.5, 1.0 and 2.0 g of calcium as carbonate or citrate found that absorption, estimated from the rise in urinary calcium, rose steeply up to 0.5 g, with only slight further increases at larger doses.
Cooking & Storage
Cooking changes oxalate more than calcium. In a laboratory analysis of nine vegetables, boiling cut soluble oxalate by 30–87% and steaming by 5–53%, and nearly all of the lost oxalate was recovered in the cooking water (Chai & Liebman, 2005); the study measured oxalate, not calcium absorption. USDA figures differ between raw and cooked greens because cooking changes water content and weight: raw kale is listed at 254 mg per 100 g and boiled kale at 150 mg. For canned fish, the bones carry the calcium: USDA lists canned pink salmon with bone and liquid at 213 mg per 100 g and without skin and bones at 60 mg.
Vegetarian & Vegan Sources
A 1999 review by Weaver, Proulx and Heaney found that some plants provide absorbable calcium, but that the quantity of vegetables needed for sufficient intake makes an exclusively plant-based diet impractical for most people unless fortified foods or supplements are included. Among the plant foods in the table, whole sesame seeds, almonds, dried figs and cooked kale, collard, turnip and mustard greens list the most calcium per 100 g, and the Linus Pauling Institute lists one medium orange at 60 mg. Spinach is listed by USDA at 136 mg per 100 g cooked, but in the Creighton isotope study only 5.1% of spinach calcium was absorbed, against 27.6% from milk, because its oxalate binds the calcium (Heaney, Weaver & Recker, 1988). For people who eat fish, canned sardines and salmon with the bones are among the highest non-dairy entries in the table.
Who Needs to Pay Attention
The body holds blood calcium within a narrow range and, when intake is inadequate, draws calcium out of the skeleton to do so; a low blood calcium level therefore usually points to a parathyroid problem rather than to low intake (Linus Pauling Institute). Chronically low intake during growth may prevent the attainment of optimal peak bone mass, and after peak bone mass it may contribute to accelerated bone loss and ultimately osteoporosis. At the other end, the reported concerns come mainly from supplements: in a placebo-controlled trial of 36,282 postmenopausal women, 1,000 mg of supplemental calcium with 400 IU of vitamin D a day was associated with more self-reported kidney stones over seven years, and supplementation of 0.6–2 g a day for two to five years has been associated with constipation, cramping, bloating and other gastrointestinal effects. Higher dietary calcium has been associated with a lower risk of kidney stones, and hypercalcemia has not been associated with calcium occurring naturally in food. Calcium decreases the absorption of nonheme iron, although supplementation for up to 12 weeks did not change iron status; high calcium intakes have not been associated with reduced zinc status, although one early study in 10 adults found that 600 mg of calcium taken with a meal halved zinc absorption from that meal. The Linus Pauling Institute reports that most experts favour obtaining as much calcium as possible from food. Decisions about supplements belong with a clinician.
Key Research Papers
- NIH Office of Dietary Supplements — Calcium Fact Sheet for Health Professionals (DV, RDA, AI, UL)
- Linus Pauling Institute — Calcium, Micronutrient Information Center
- Karosas T, Reyes E, Forester S, Israel E, Weaver CM (2026). Global calcium bioavailability. The Journal of Nutrition 156(9):101759. — PubMed PMID: 42508578
- Heaney RP, Weaver CM, Recker RR (1988). Calcium absorbability from spinach. The American Journal of Clinical Nutrition 47(4):707–709. — PubMed PMID: 3354496
- Heaney RP, Weaver CM (1990). Calcium absorption from kale. The American Journal of Clinical Nutrition 51(4):656–657. — PubMed PMID: 2321572
- Weaver CM, Proulx WR, Heaney R (1999). Choices for achieving adequate dietary calcium with a vegetarian diet. The American Journal of Clinical Nutrition 70(3 Suppl):543S–548S. — PubMed PMID: 10479229
- Harvey JA, Zobitz MM, Pak CY (1988). Dose dependency of calcium absorption: a comparison of calcium carbonate and calcium citrate. Journal of Bone and Mineral Research 3(3):253–258. — PubMed PMID: 3213620
- Chai W, Liebman M (2005). Effect of different cooking methods on vegetable oxalate content. Journal of Agricultural and Food Chemistry 53(8):3027–3030. — PubMed PMID: 15826055
- U.S. Department of Agriculture, Agricultural Research Service — FoodData Central, SR Legacy (calcium, glucose and fructose values and portion weights). — fdc.nal.usda.gov
- Electronic Code of Federal Regulations — 21 CFR 101.9, Nutrition labeling of food (Daily Value for calcium: 1,300 mg). — eCFR 21 CFR 101.9